- Analytics
- Technical Analysis
Hang Seng Index Technical Analysis - Hang Seng Index Trading: 2017-10-19
Positive data bullish for Hong Kong stock index
Recent economic data indicate continued expansion of Hong Kong economy. Will HK 50 continue rising?
Positive data point to continued expansion of Hong Kong economy. The Nikkei Hong Kong Purchasing Managers’ Index jumped to 51.2 in September from 49.7 in August. A reading above 50 indicates expansion in the private sector. Retail sales were robust at 3.2% on year in August, after 29-month high 4.5% annual growth in July.
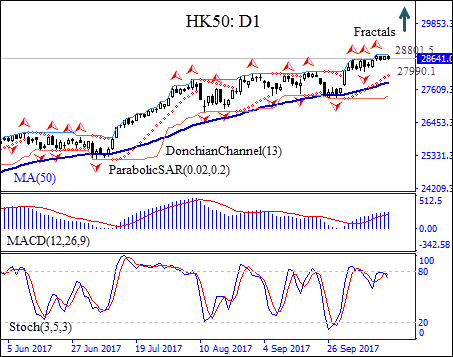
On the daily timeframe HK 50: D1 has been in upward trend since the beginning of 2017. The price has remained above the 50-day moving average MA(50) which has acted as a support in that period.
- The Donchian channel indicates uptrend : it is tilted up.
- The Parabolic indicator has formed a buy signal.
- The MACD indicator is bullish: it is above the signal line and the gap is widening.
- The stochastic oscillator is declining after falling back from the overbought zone boundary.
We believe the bullish momentum will continue after the price closes above the upper boundary of Donchian channel at 28801.5. It can be used as an entry point for placing a pending order to buy. The stop loss can be placed below the Parabolic signal at 27990.1. After placing the order, the stop loss is to be moved every day to the next fractal low, following Parabolic signals. Thus, we are changing the probable profit/loss ratio to the breakeven point. If the price meets the stop loss level (27990.1) without reaching the order (28801.5), we recommend cancelling the position: the market has undergone internal changes which were not taken into account.
Technical Analysis Summary
| Position | Buy |
| Buy stop | Above 28801.5 |
| Stop loss | Below 27990.1 |
Explore our
Trading Conditions
- Spreads from 0.0 pip
- 30,000+ Trading Instruments
- Stop Out Level - Only 10%
Ready to Trade?
Open Account Note:
This overview has an informative and tutorial character and is published for free. All the data, included in the overview, are received from public sources, recognized as more or less reliable. Moreover, there is no guarantee that the indicated information is full and precise. Overviews are not updated. The whole information in each overview, including opinion, indicators, charts and anything else, is provided only for familiarization purposes and is not financial advice or а recommendation. The whole text and its any part, as well as the charts cannot be considered as an offer to make a deal with any asset. IFC Markets and its employees under any circumstances are not liable for any action taken by someone else during or after reading the overview.
