- Analytics
- Technical Analysis
Hang Seng Index Technical Analysis - Hang Seng Index Trading: 2019-05-02
Widening trade deficit bearish for HK50
Hong Kong trade deficit widened in March. Will the HK50 decline continue?
Chinese economic data were weak recently: Caixin China manufacturing purchasing managers index dropped to 50.2 in April from 50.8 in March, while Hong Kong’s trade deficit widened to H$59.2 billion in March from H$48.8 billion in February. Mainland China’s factory activity weakened in April but still recorded expansion: a reading above the 50 level indicates an expansion in activity. Hong Kong trade deficit increased by 6.7% in March from H$55.5 billion in the same month of the previous year as exports fell 1.2% while imports declined 0.1%. The downtrend in Honk Kong’s exports is still intact due mainly to declining manufacturing and trade activities in the region, according to state statistics agency. The US-China trade dispute is a downside risk for Hong Kong stock market while there are positive developments: Treasury Secretary Steven Mnuchin and Trade Representative Robert Lighthizer resumed trade negotiations with China, with sides reportedly close to a final deal.
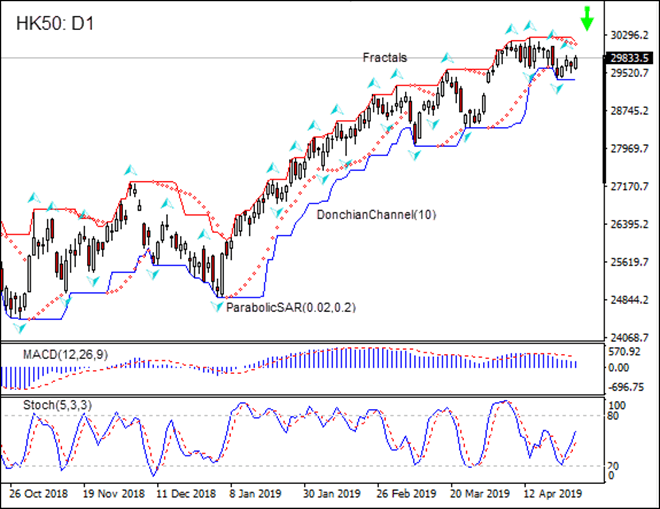
On the daily timeframe HK50: D1 is retracing after hitting 11-month high in mid-April.
- The Parabolic indicator has formed a sell signal.
- The Donchian channel indicates downtrend: it is narrowing down.
- The MACD indicator is above the signal line with the gap narrowing. This is a bearish signal.
- The Stochastic oscillator is rising but has not reached the overbought zone.
We believe the bearish momentum will continue after the price breaches below the lower Donchian boundary at 29373.5. This level can be used as an entry point for placing a pending order to sell. The stop loss can be placed above the upper Donchian boundary at 30176.5. After placing the pending order the stop loss is to be moved every day to the next fractal high, following Parabolic signals. Thus, we are changing the expected profit/loss ratio to the breakeven point. If the price meets the stop-loss level (30176.5) without reaching the order (29373.5) we recommend cancelling the order: the market sustains internal changes which were not taken into account.
Technical Analysis Summary
| Position | Sell |
| Sell Stop | Below 29373.5 |
| Stop loss | Above 30176.5 |
Explore our
Trading Conditions
- Spreads from 0.0 pip
- 30,000+ Trading Instruments
- Stop Out Level - Only 10%
Ready to Trade?
Open Account Note:
This overview has an informative and tutorial character and is published for free. All the data, included in the overview, are received from public sources, recognized as more or less reliable. Moreover, there is no guarantee that the indicated information is full and precise. Overviews are not updated. The whole information in each overview, including opinion, indicators, charts and anything else, is provided only for familiarization purposes and is not financial advice or а recommendation. The whole text and its any part, as well as the charts cannot be considered as an offer to make a deal with any asset. IFC Markets and its employees under any circumstances are not liable for any action taken by someone else during or after reading the overview.
