- Analytics
- Technical Analysis
Hog Futures Technical Analysis - Hog Futures Trading: 2019-09-03
China increased pork imports
Pork imports to China in July 2019 increased by more than 2 times compared to the same period last year. Will the LHOG quotations grow ?
China is the largest buyer of pork in the world market. Due to African swine fever (African swine fever (ASF)), the number of pigs in the country has been greatly reduced. According to the Chinese General Administration of Customs, pork imports in July this year increased by 107% compared to July 2018 and reached 182.2 thousand tons. This is much more than the June indicator of 2019, which amounted to 160.5 thousand tons. For 7 months of this year, pork imports to China increased by 36% and reached 1 million tons. Due to ASF, the pig population in China in July 2019 was 32.2% less than last year. According to the US Department of Agriculture, pig slaughter in the United States in January-August 2019 increased by 3% compared with the same period in 2018 and amounted to 83.77 million heads. China has reduced the purchase of American pork to a minimum as retaliatory trade sanctions. However, its share in US exports was replaced by buyers from Japan, Mexico and other countries.
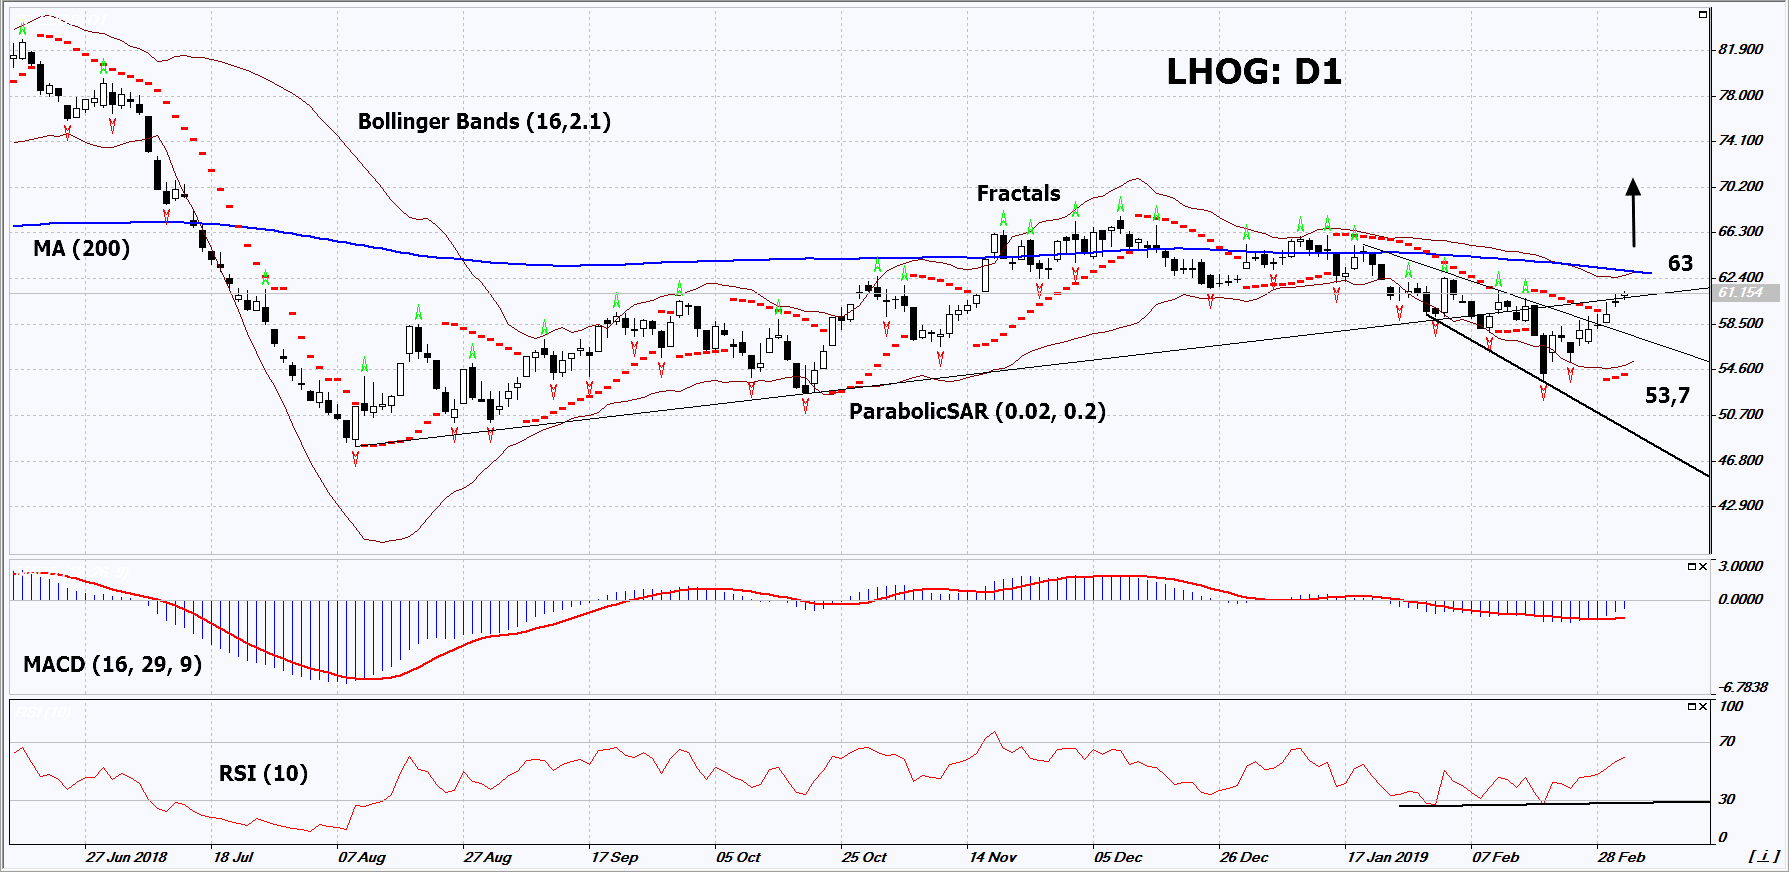
On the daily timeframe LHOG: D1 has overcome the downtrend resistance line.Various technical analysis indicators have generated signals to increase. Further growth of quotations is possible in the event of an increase in global demand for pork.
- The Parabolic indicator demonstrates a signal to increase.
- The Bolinger bands broadened, indicating high volatility. The bottom line of the Bollinger has a slope up.
- The RSI indicator is below the 50 mark. It has formed a divergence to increase.
- The MACD indicator gives a bullish signal.
The bullish momentum may develop if LHOG exceeds its last maximum: 65.3. This level can be used as an entry point. The initial stop lose may be placed below the last lower fractal and the Parabolic signal: 59. After opening a pending order, stop shall be moved folowing the Bollinger and Parabolic signals to the next fractal minimum. Thus, we are changing the potential profit/loss to the breakeven point. More risk-averse traders may switch to the 4-hour chart after the trade and place a stop loss moving it in the direction of the trade. If the price meets the stop level (59) without reaching the order (65,3), we recommend to cancel the order: the market sustains internal changes that were not taken into account.
Technical Analysis Summary
| Position | Buy |
| Buy stop | Above 65,3 |
| Stop loss | Below 59 |
Explore our
Trading Conditions
- Spreads from 0.0 pip
- 30,000+ Trading Instruments
- Stop Out Level - Only 10%
Ready to Trade?
Open Account Note:
This overview has an informative and tutorial character and is published for free. All the data, included in the overview, are received from public sources, recognized as more or less reliable. Moreover, there is no guarantee that the indicated information is full and precise. Overviews are not updated. The whole information in each overview, including opinion, indicators, charts and anything else, is provided only for familiarization purposes and is not financial advice or а recommendation. The whole text and its any part, as well as the charts cannot be considered as an offer to make a deal with any asset. IFC Markets and its employees under any circumstances are not liable for any action taken by someone else during or after reading the overview.
