- Analytics
- Technical Analysis
Gas Ruble Technical Analysis - Gas Ruble Trading: 2019-06-26
Against the backdrop of heat in the United States may increase the demand for electricity for air conditioners
In this review, we suggest to consider the Personal Composite Instrument (PCI) Gas vs Ruble. It reflects the price dynamics of US natural gas versus Russian ruble. Will the GAS/RUB quotations increase ?
Such movement indicates that natural gas in the United States becomes more expensive, and the ruble is weakened. The Bank of Russia lowered its key rate at a meeting on June 14, 2019 to 7.5% from 7.75%. At the same time, inflation in Russia is 5.1%, which is significantly higher than the target level of the Central Bank of the Russian Federation (4%). The Russian regulator reduces the rate in order to maintain very weak economic growth and prevent capital outflow. Against the background of relatively high inflation and actual stagnation in the economy, this may adversely affect the ruble exchange rate. In turn, the possible growth of quotations of natural gas in the United States can contribute to an increase in demand for electricity for air conditioners during the hot weather in the United States. The agency Refinitiv predicts an increase in gas consumption in the US next week to 87.2 billion cubic feet per day compared to 83.4 billion this week. Another factor in favor of the growth of quotations could be an increase in the capacity of terminals for the export of American liquefied natural gas from the current level of 5.7 billion cubic feet per day to 7.4 million by the end of 2019 and to 10 million by 2020. At the same time, U.S. Energy Information Administration does not expect further significant growth in US gas production. According to its forecast, on average for the entire current year it will be 90.6 billion cubic feet per day. Whereas production this week has already reached 89.9 billion.
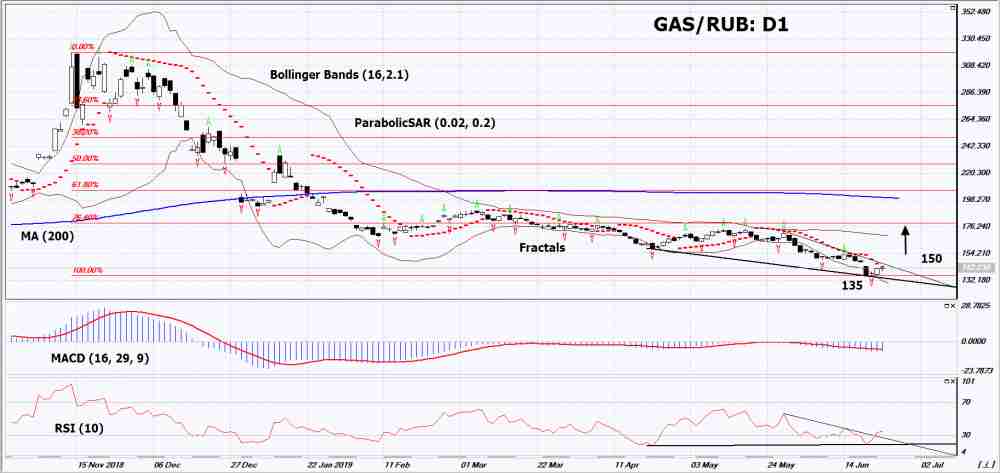
On the daily timeframe GAS/RUB: D1 moved closer to the resistance line of the downtrend. It must be punched up before opening a buy position. Various technical analysis indicators have generated upside signals. Further growth of quotations is possible if the demand for gas in the United States increases and the Russian ruble weakens.
- The Parabolic indicator indicates downtrend signal. It can be used as an additional resistance level that must be overcome before opening a buy position.
- The Bolinger bands widened, indicating high volatility.
- The RSI indicator is below 50. It has formed a divergence to increase.
- The MACD indicator shows a weak uptrend signal.
The bullish momentum may develop in case if GAS/RUB exceeds the Parabolic signal, close the price gap on the daily chart and overcome the resistance trend line of the downward trend: 150. This level may serve as an entry point. The initial stop loss may be placed lower than the last lower fractal and the minimum since April 2016: 135. After opening the pending order, we shall move the stop to the next fractal low following the Bollinger and Parabolic signals. Thus, we are changing the potential profit/loss to the breakeven point. More risk-averse traders may switch to the 4-hour chart after the trade and place a stop loss moving it in the direction of the trade. If the price meets the stop level (135) without reaching the order (150), we recommend to cancel the order: the market sustains internal changes that were not taken into account.
Technical Analysis Summary
| Position | Buy |
| Buy stop | Above 150 |
| Stop loss | Below 135 |
Explore our
Trading Conditions
- Spreads from 0.0 pip
- 30,000+ Trading Instruments
- Stop Out Level - Only 10%
Ready to Trade?
Open Account Note:
This overview has an informative and tutorial character and is published for free. All the data, included in the overview, are received from public sources, recognized as more or less reliable. Moreover, there is no guarantee that the indicated information is full and precise. Overviews are not updated. The whole information in each overview, including opinion, indicators, charts and anything else, is provided only for familiarization purposes and is not financial advice or а recommendation. The whole text and its any part, as well as the charts cannot be considered as an offer to make a deal with any asset. IFC Markets and its employees under any circumstances are not liable for any action taken by someone else during or after reading the overview.
