- Analytics
- Technical Analysis
Natural Gas Prices Technical Analysis - Natural Gas Prices Trading: 2017-07-19
Hot weather in the US increases demand for air conditioning
Hot weather is forecasted for the next 2 weeks in US and temperatures will be above the average for this period of year. Will natural gas prices rise? It is used to produce electric power for air conditioners.
According to forecasts, the daily consumption of natural gas in the US may rise to 79.4 billion cubic feet compared to 77.7 billion in the last week. Gas production in the country has increased to 72 billion cubic feet per day, which is higher than the last year's level of 70.7 billion cubic feet. At the same time, its exports increased by 41% to 8.2 billion cubic feet. The National Weather Service expects that the temperature in July will be above the norm, and in August - close to the usual level. Gas reserves in the US are now estimated at the level of 1.7 trillion cubic feet, which is noticeably below the average for the past 5 years, amounting to 2.1 trillion. Relatively low level of reserves with increased demand can contribute to the further gas prices growth.
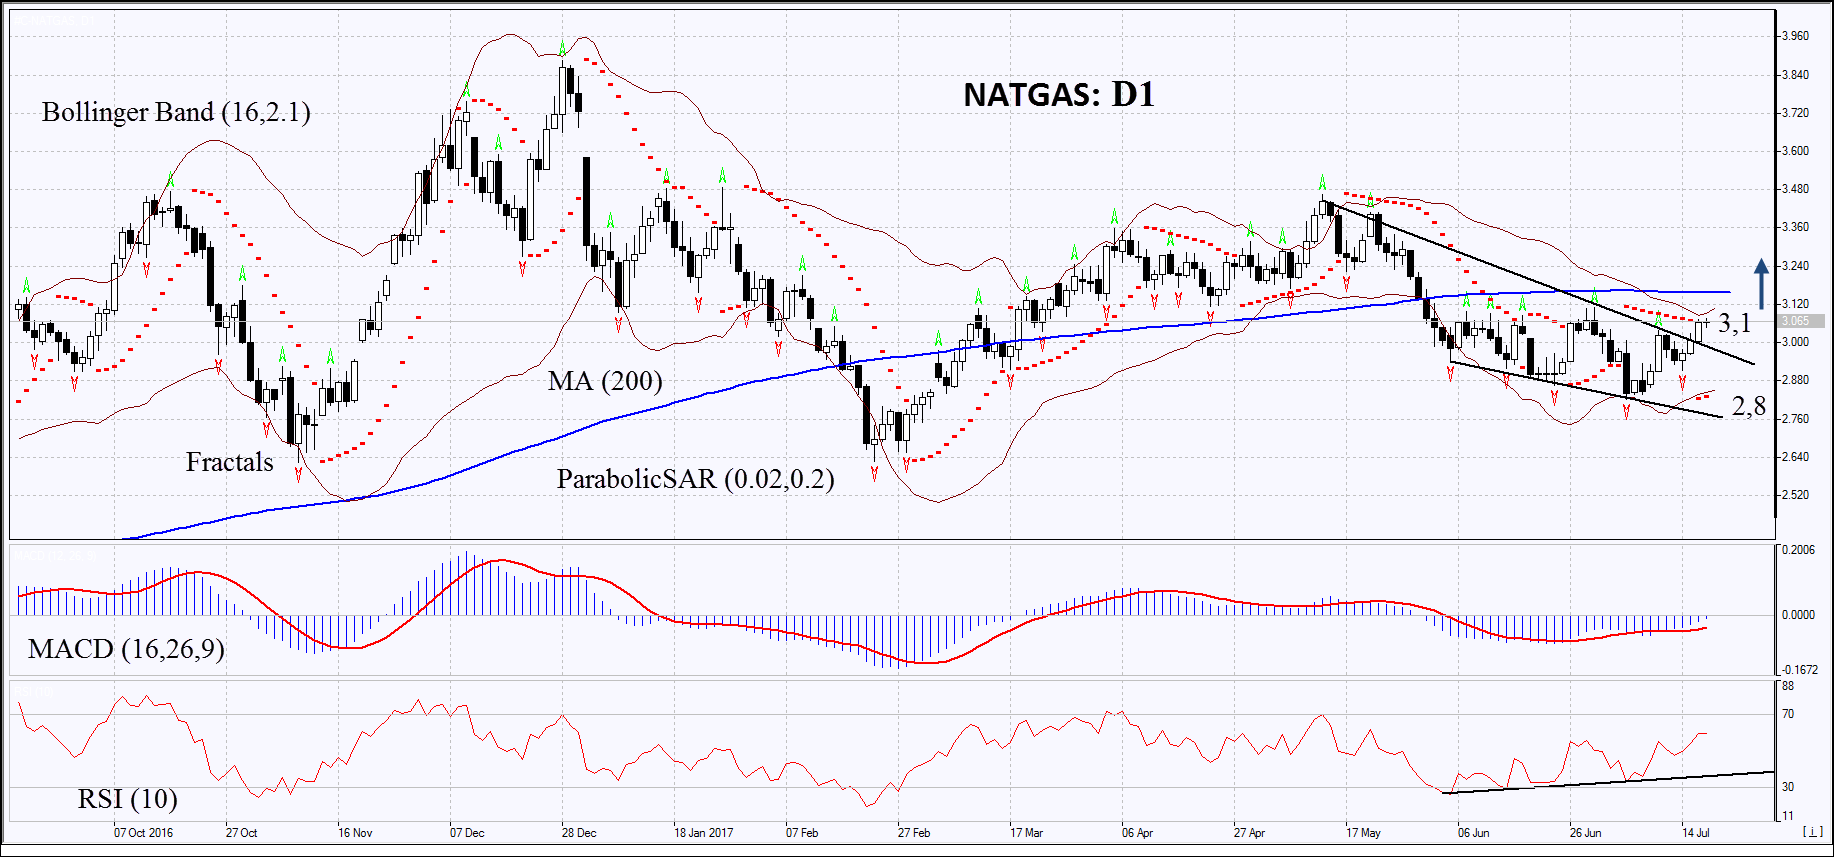
On the daily timeframe, NATGAS: D1 has edged up from the downtrend. The further price increase is possible in case of a reduction in natural gas production in the US, as well as in case of maintaining high demand against the background of increased electricity consumption for air conditioning.
- The Parabolic indicator gives a bullish signal.
- The Bollinger bands have narrowed, which indicates low volatility. They are titled upwards.
- The RSI indicator is above 50. It has formed a positive divergence.
- The MACD indicator gives a bullish signal.
The bullish momentum may develop in case Natgas exceeds the upper Bollinger band at 3.1. This level may serve as an entry point. The initial stop-loss may be placed below the two last fractal lows, the Parabolic indicator and the lower Bollinger band at 2.8. After opening the pending order, we shall move the stop to the next fractal low following the Bollinger and Parabolic signals. Thus, we are changing the potential profit/loss to the breakeven point. More risk-averse traders may switch to the 4-hour chart after the trade and place there a stop loss moving it in the direction of the trade. If the price meets the stop level at 2.8 without reaching the order at 3.1 we recommend cancelling the position: the market sustains internal changes that were not taken into account.
Summary of technical analysis
| Position | Buy |
| Buy stop | Above 3,1 |
| Stop loss | Below 2,8 |
Explore our
Trading Conditions
- Spreads from 0.0 pip
- 30,000+ Trading Instruments
- Stop Out Level - Only 10%
Ready to Trade?
Open Account Note:
This overview has an informative and tutorial character and is published for free. All the data, included in the overview, are received from public sources, recognized as more or less reliable. Moreover, there is no guarantee that the indicated information is full and precise. Overviews are not updated. The whole information in each overview, including opinion, indicators, charts and anything else, is provided only for familiarization purposes and is not financial advice or а recommendation. The whole text and its any part, as well as the charts cannot be considered as an offer to make a deal with any asset. IFC Markets and its employees under any circumstances are not liable for any action taken by someone else during or after reading the overview.
