- Analytics
- Technical Analysis
Nikkei Index Technical Analysis - Nikkei Index Trading: 2019-04-04
Positive data bullish for NIKKEI
Japanese retail sales and housing starts increased in February. Will the NIKKEI continue rising?
Recent Japanese economic data were positive on balance: while the Tankan index for big manufacturers' sentiment softened in the first quarter 2019 from the previous three-month period, retail sales inched up 0.2% over month in February after 2.3% decline in January, and housing starts rose 4.1% from 1.1% over year in February. And while services sector expansion slowed a bit in March as Nikkei Services PMI ticked to 52 from 52.3 in February, the manufacturing sector contraction slowed. Most of the decline was due to weaker foreign sales to China and Taiwan. But international trade prospects have been improving lately with China’s Vice Premier Liu He arriving in Washington on Tuesday for a continuation of high-level talks held last week in Beijing after U.S. Chamber of Commerce executive’s comment “ninety percent of the deal is done, but the last 10% is the hardest part” about talks' progress so far. Positive data are bullish for NIKKEI.
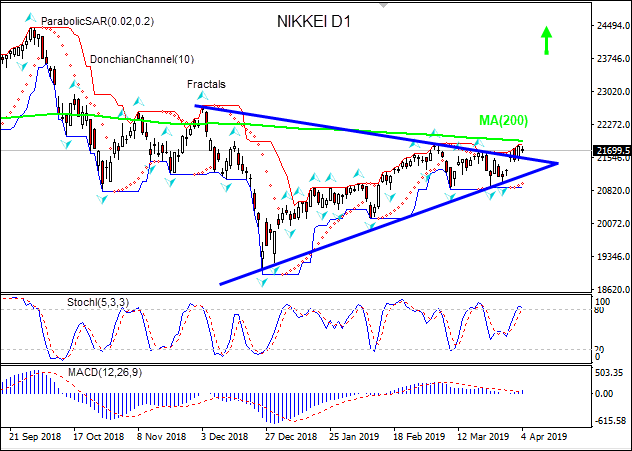
On the daily timeframe the Nikkei: D1 is rising after hitting 19-month low in the end of December. The price has risen above the resistance line, this is bullish.
- The Parabolic indicator gives a buy signal.
- The Donchian channel indicates uptrend: it is widening up.
- The MACD indicator gives a bullish signal: it is above the signal line and the gap is widening.
- The Stochastic oscillator is in the overbought zone but is set to decline.
We believe the bullish momentum will continue after the price closes above the upper boundary of Donchian channel at 21834.2. This level can be used as an entry point for placing a pending order to buy. The stop loss can be placed below the fractal low at 20870.8. After placing the order, the stop loss is to be moved every day to the next fractal low, following Parabolic signals. Thus, we are changing the expected profit/loss ratio to the breakeven point. If the price meets the stop loss level (20870.8) without reaching the order (21834.2), we recommend cancelling the order: the market has undergone internal changes which were not taken into account.
Technical Analysis Summary
| Position | Buy |
| Buy stop | Above 21834.2 |
| Stop loss | Below 20870.8 |
Explore our
Trading Conditions
- Spreads from 0.0 pip
- 30,000+ Trading Instruments
- Stop Out Level - Only 10%
Ready to Trade?
Open Account Note:
This overview has an informative and tutorial character and is published for free. All the data, included in the overview, are received from public sources, recognized as more or less reliable. Moreover, there is no guarantee that the indicated information is full and precise. Overviews are not updated. The whole information in each overview, including opinion, indicators, charts and anything else, is provided only for familiarization purposes and is not financial advice or а recommendation. The whole text and its any part, as well as the charts cannot be considered as an offer to make a deal with any asset. IFC Markets and its employees under any circumstances are not liable for any action taken by someone else during or after reading the overview.
