- Analytics
- Technical Analysis
Orange Juice Technical Analysis - Orange Juice Trading: 2017-07-26
Orange juice reserves reduced in the US
The US Department of Agriculture (USDA) reported a decrease in orange juice reserves. Will its prices grow?
The frozen orange juice reserves decreased to 544.4 mln pounds on June 30, 2017, compared with 575.4 mln pounds or 5.4% on May 31, 2017. Compared with the beginning of July of the last year, they declined by 29%. The exports of orange juice from Brazil decreased by 17% from July 2016 to June 2017 compared with the same period of the last year and amounted to 890 thousand tonnes. This is the minimum volume over the last 25 years.
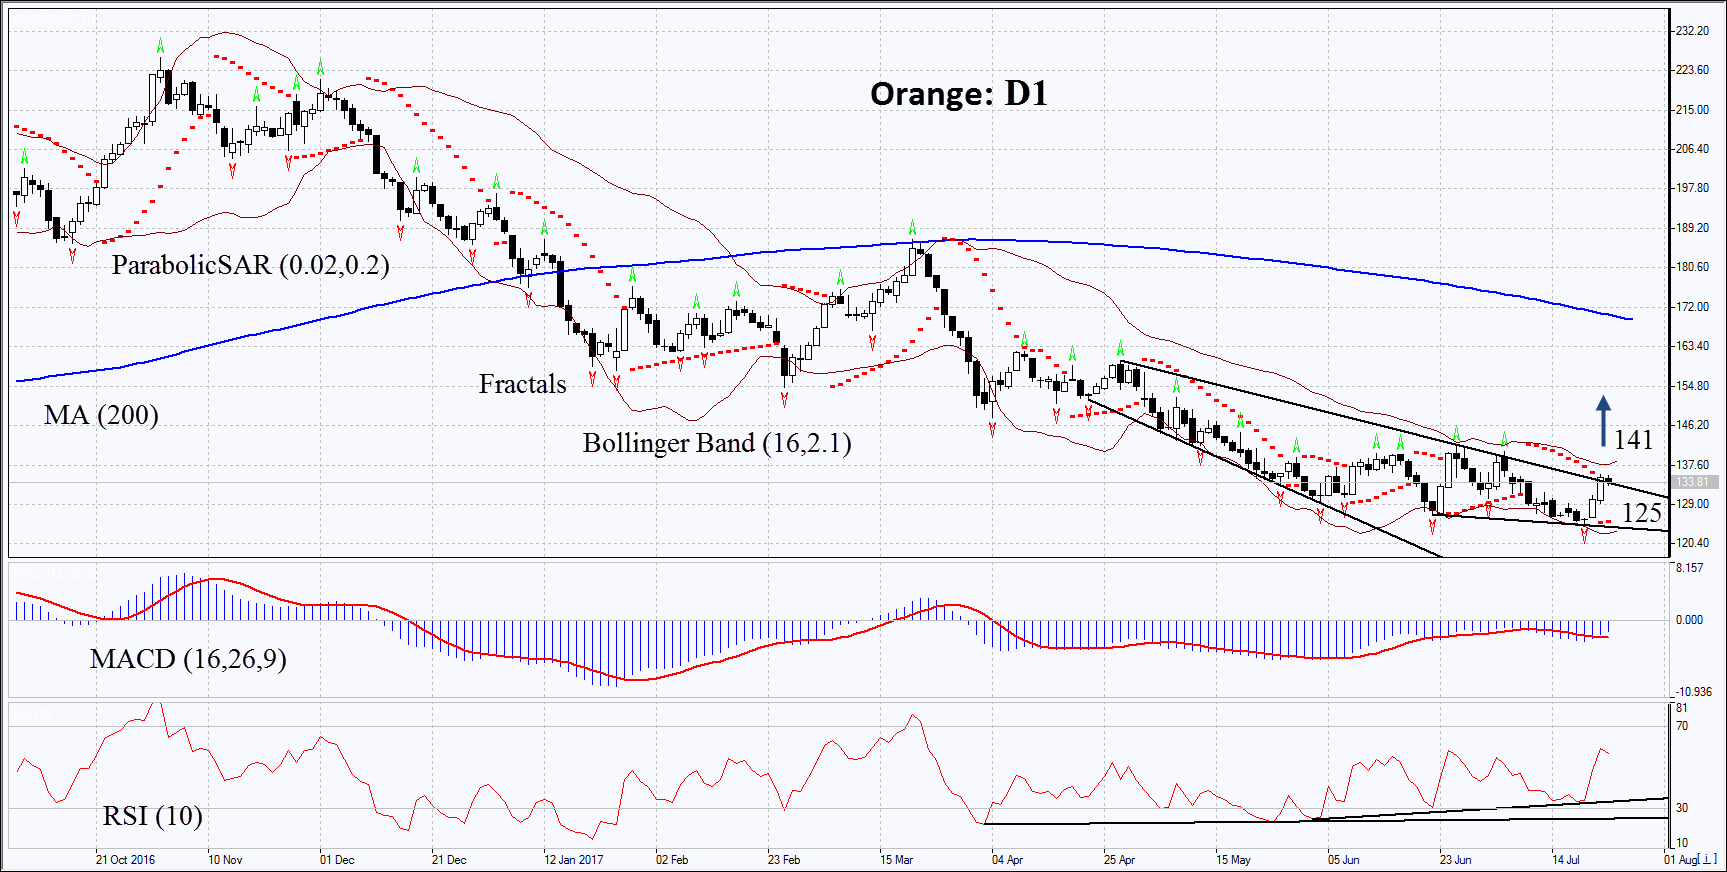
On the daily timeframe, ORANGE: D1 approached the resistance line of a downtrend. To open a buy position, it needs to be overcome. The further price increase is possible in case of a further reduction of the orange juice reserves in the US and citrus fruits crops in Brazil.
- The Parabolic indicator gives a bullish signal.
- The Bollinger bands have narrowed, which means lower volatility. They are tilted upwards.
- The RSI indicator is above 50. It has formed a positive divergence.
- The MACD indicator indicator gives a bullish signal.
The bullish momentum may develop in case ORANGE exceeds the upper Bollinger band and the last fractal high at 141. This level may serve as an entry point. The initial stop loss may be placed below the last fractal low, the Parabolic signal and the 15-month low at 125. After opening the pending order, we shall move the stop to the next fractal low following the Bollinger and Parabolic signals. Thus, we are changing the potential profit/loss to the breakeven point. More risk-averse traders may switch to the 4-hour chart after the trade and place there a stop loss moving it in the direction of the trade. If the price meets the stop level at 125 without reaching the order at 141 we recommend cancelling the position: the market sustains internal changes that were not taken into account.
Summary of technical analysis
| Position | Buy |
| Buy stop | Above 141 |
| Stop loss | Below 125 |
Explore our
Trading Conditions
- Spreads from 0.0 pip
- 30,000+ Trading Instruments
- Stop Out Level - Only 10%
Ready to Trade?
Open Account Note:
This overview has an informative and tutorial character and is published for free. All the data, included in the overview, are received from public sources, recognized as more or less reliable. Moreover, there is no guarantee that the indicated information is full and precise. Overviews are not updated. The whole information in each overview, including opinion, indicators, charts and anything else, is provided only for familiarization purposes and is not financial advice or а recommendation. The whole text and its any part, as well as the charts cannot be considered as an offer to make a deal with any asset. IFC Markets and its employees under any circumstances are not liable for any action taken by someone else during or after reading the overview.
