- Analytics
- Technical Analysis
Rice Investments Technical Analysis - Rice Investments Trading: 2018-12-04
Global rice shortage is expected
The British company Economist Intelligence Unit (EIU) has published another review of the global rice market. Will Rice price continue to rise?
According to forecasts of the EIU, the global rice consumption in the 2018/19 agricultural season will increase by 1.4% to a record level of 500 million tons. In the next 2019/20 season, it will increase by another 1% to 505 million tons. At the same time, the world rice production in 2018/19 season will be only 493 million tons and in 2019/20, it will increase only to 499 million tons. Thus, until 2020, there will be a shortage of rice in the world, which should be covered from world reserves. A winter rice sowing reduction is expected in India because of drought in the current 2018/19 season to 0.733 million hectares from 1.051 million hectares in the 2017/18 season. Another factor, which may contribute to the increase in rice prices is its purchase by Iran from India in exchange for Iranian oil. Let us note that the Philippine state agency National Economic and Development Authority (NEDA) is going to reduce import tariffs with the aim of compensating the possible increase in rice prices. Recently, the Philippines purchased 203 thousand tons of rice from Thailand and Vietnam.
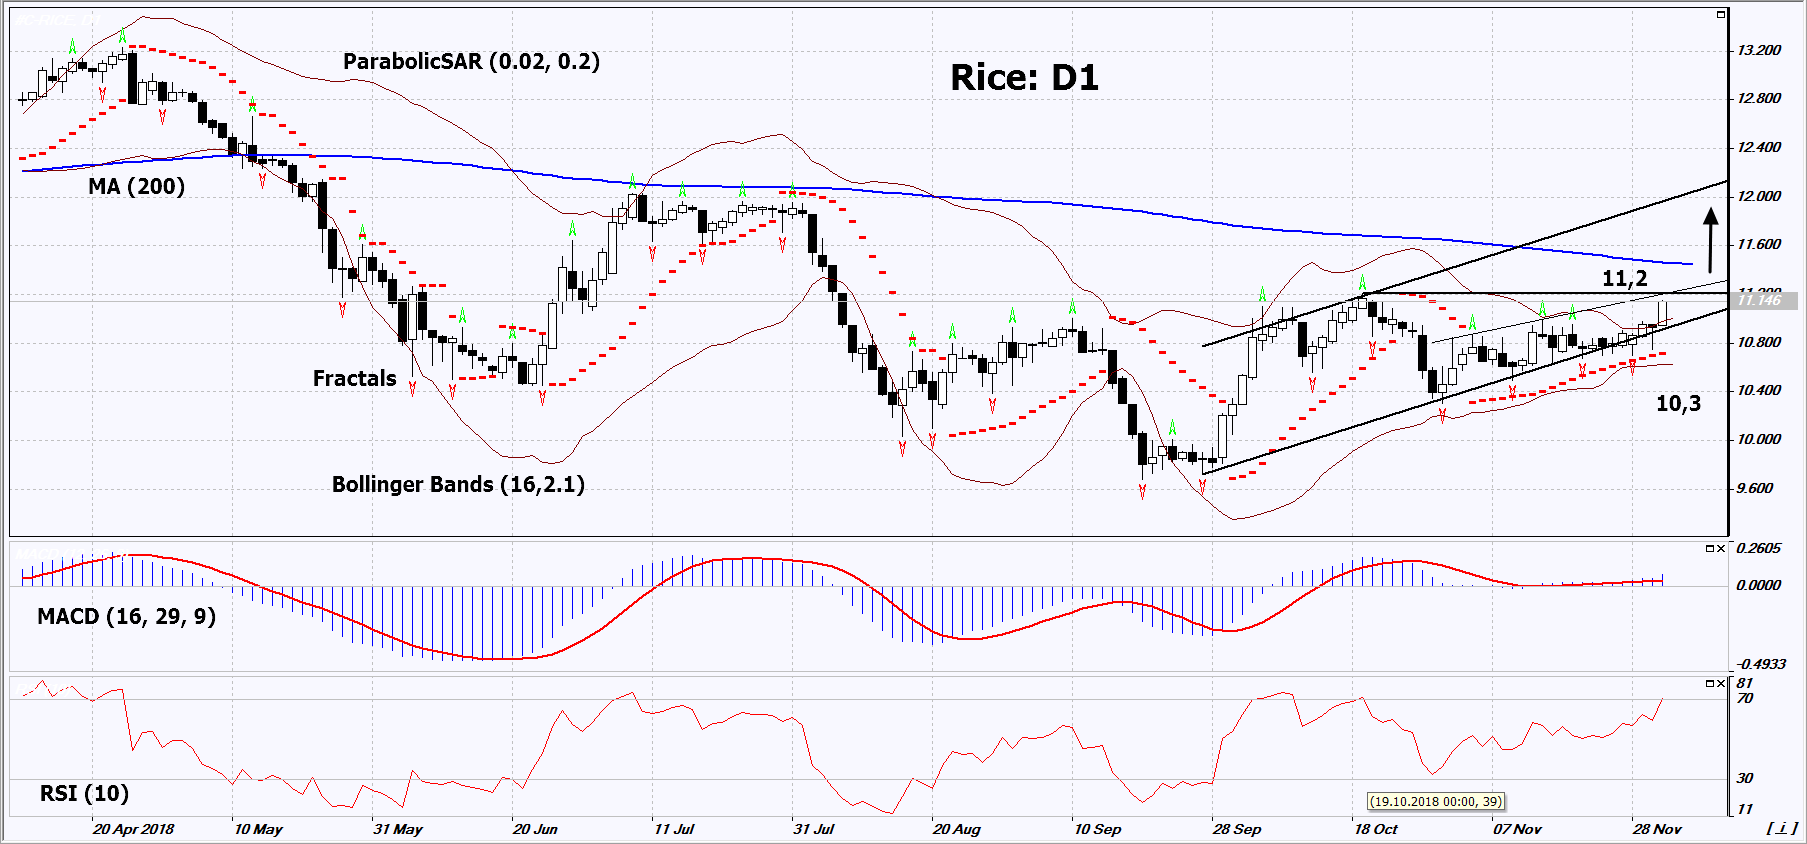
On the daily timeframe, Rice: D1 is rising within the growing channel. A number of technical analysis indicators formed buy signals. The further price increase is possible in case of the deterioration of weather conditions and a reduction in world harvest in the current season.
- The Parabolic indicator gives a bullish signal.
- The Bollinger bands have narrowed strongly, which indicates low volatility. Both bands are titled upwards.
- The RSI indicator is above 50. No divergence.
- The MACD indicator gives a bullish signal.
The bullish momentum may develop in case Rice exceeds its four last fractal highs at 11.2. This level may serve as an entry point. The initial stop loss may be placed below the four last fractal lows, the Parabolic signal and the lower Bollinger band at 10.3. After opening the pending order, we shall move the stop to the next fractal low following the Bollinger and Parabolic signals. Thus, we are changing the potential profit/loss to the breakeven point. More risk-averse traders may switch to the 4-hour chart after the trade and place there a stop loss moving it in the direction of the trade. If the price meets the stop level (10.3) without reaching the order (11.2), we recommend to close the position: the market sustains internal changes that were not taken into account.
Summary of technical analysis
| Position | Buy |
| Buy stop | Above 11.2 |
| Stop loss | Below 10.3 |
Explore our
Trading Conditions
- Spreads from 0.0 pip
- 30,000+ Trading Instruments
- Stop Out Level - Only 10%
Ready to Trade?
Open Account Note:
This overview has an informative and tutorial character and is published for free. All the data, included in the overview, are received from public sources, recognized as more or less reliable. Moreover, there is no guarantee that the indicated information is full and precise. Overviews are not updated. The whole information in each overview, including opinion, indicators, charts and anything else, is provided only for familiarization purposes and is not financial advice or а recommendation. The whole text and its any part, as well as the charts cannot be considered as an offer to make a deal with any asset. IFC Markets and its employees under any circumstances are not liable for any action taken by someone else during or after reading the overview.
