- Analytics
- Technical Analysis
SUGAR Technical Analysis - SUGAR Trading: 2017-05-17
Weather may affect sugar crops
According to the India Meteorological Department forecast, the monsoon season will start in India at the end of August. The weather bureau increased the forecast of precipitation. Will the sugar prices rise?
India is the world’s 2nd sugar producer (after Brazil) and the largest consumer. It is worth mentioning that Brazil has significant capacity for the production of ethanol from sugar cane. It may switch to the production of either fuel or sugar, depending on global prices. In the current agricultural season, the sugar cane crops are expected to increase by 3.4% in Brazil. However, there is no single forecast yet about the volume that will be processed into ethanol. The US Department of Agriculture expects a decrease in sugar production in the US by 3.2% to 8.7 mln. American tons (907 kg) in 2017. Meanwhile, sugar consumption may increase by 3.3% to 12.5 mln. American tons.
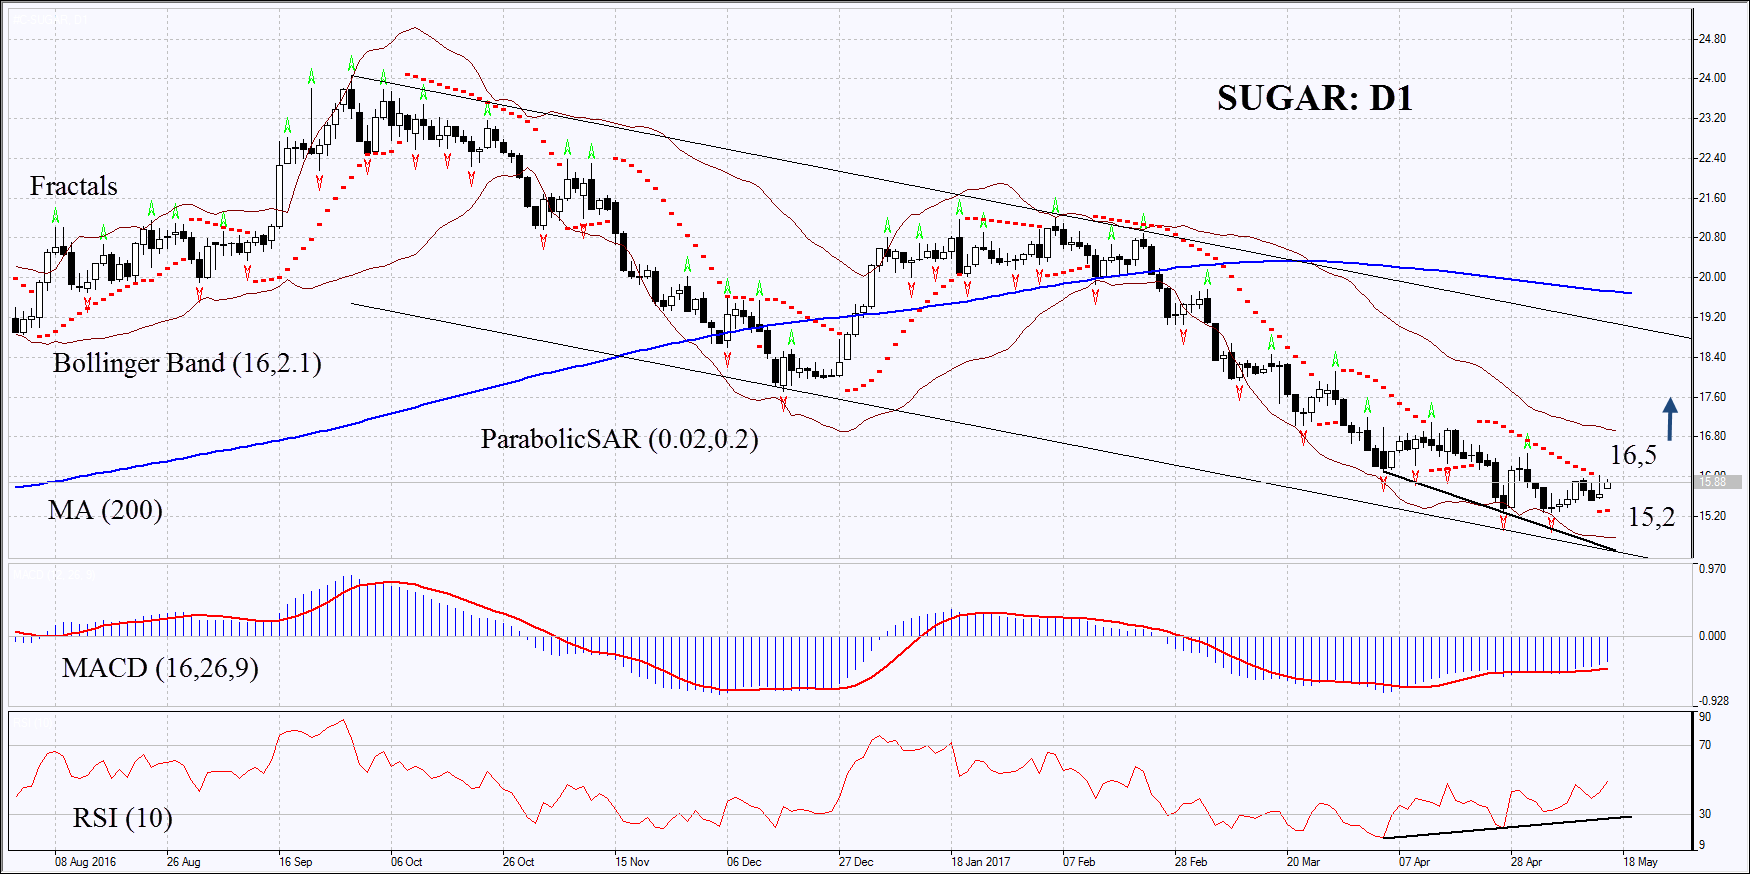
On the daily timeframe, Sugar: D1 is in a downtrend. Currently, it is trying to correct upwards from the annual low. The further price increase is possible in case of the weather deterioration in India and other producer countries.
- The Parabolic indicator gives a bullish signal.
- The Bollinger bands have narrowed, which means lower volatility.
- The RSI is below 50. It has formed a positive divergence.
- The MACD gives a bullish signal.
The bullish momentum may develop in case Sugar exceeds the last fractal high at 16.5. This level may serve as an entry point. The initial stop-loss may be placed below the 2 last fractal lows, the annual low and the Parabolic signal at 15.2. After opening the pending order, we shall move the stop to the next fractal low following the Bollinger and Parabolic signals. Thus, we are changing the potential profit/loss to the breakeven point. More risk-averse traders may switch to the 4-hour chart after the trade and place there a stop-loss moving it in the direction of the trade. If the price meets the stop level at 15.2 without reaching the order at 16.5 we recommend cancelling the position: the market sustains internal changes that were not taken into account.
Summary of technical analysis
| Position | Buy |
| Buy stop | above 16,5 |
| Stop loss | below 15,2 |
Explore our
Trading Conditions
- Spreads from 0.0 pip
- 30,000+ Trading Instruments
- Stop Out Level - Only 10%
Ready to Trade?
Open Account Note:
This overview has an informative and tutorial character and is published for free. All the data, included in the overview, are received from public sources, recognized as more or less reliable. Moreover, there is no guarantee that the indicated information is full and precise. Overviews are not updated. The whole information in each overview, including opinion, indicators, charts and anything else, is provided only for familiarization purposes and is not financial advice or а recommendation. The whole text and its any part, as well as the charts cannot be considered as an offer to make a deal with any asset. IFC Markets and its employees under any circumstances are not liable for any action taken by someone else during or after reading the overview.
