- Analytics
- Technical Analysis
SUGAR Technical Analysis - SUGAR Trading: 2019-10-25
Expectations of higher crop and exports bearish for sugar price
Brazil’s sugar output is expected to rise in September while India subsidizes its exports. Will the sugar prices continue declining?
Sugar global price is depressed due to ample global supply. India’s government established export subsidy in the end of August to support sugar mills in shipping 6 million tons of sugar in 2019/20 October-September season. India is the fourth largest sugar exporter in the world. And Indian sugar mills are aggressively selling 2018/19 old crop sugar to Iran: they reached agreement to export 350,000 tons of sugar to Iran a week ago. A couple weeks ago S&P Global Platts analysts survey projected the sugarcane crush in the key Center-South Brazil region is expected to total 36.44 million tons in the second half of September, an increase of 30.9% year on year. And the proportion of cane used for sugar production is expected to be 34.44%, up from 33.02% a year earlier. Brazil is top sugar exporter in the world. Expectations of ample global supply are bearish for sugar prices.
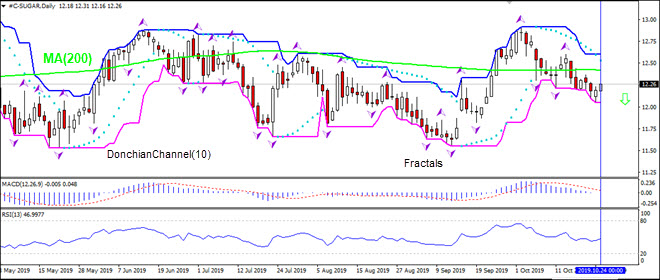
On the daily timeframe the SUGAR: D1 is below the 200-day moving average MA(200) which is falling, this is bearish.
- The Parabolic indicator gives a sell signal.
- The Donchian channel indicates no trend: it is flat.
- The MACD indicator gives a bearish signal: it is below the signal line and the gap is widening.
- The RSI oscillator is rising but has not reached the overbought zone.
We believe the bearish momentum will continue after the price breaches below the lower boundary of Donchian channel at 12.05. This level can be used as an entry point for placing a pending order to sell. The stop loss can be placed above the last fractal high at 12.60. After placing the order, the stop loss is to be moved every day to the next fractal high, following Parabolic signals. Thus, we are changing the expected profit/loss ratio to the breakeven point. If the price meets the stop loss level (12.60) without reaching the order (12.05), we recommend cancelling the order: the market has undergone internal changes which were not taken into account.
Technical Analysis Summary
| Order | Sell |
| Sell stop | Below 12.05 |
| Stop loss | Above 12.60 |
Explore our
Trading Conditions
- Spreads from 0.0 pip
- 30,000+ Trading Instruments
- Stop Out Level - Only 10%
Ready to Trade?
Open Account Note:
This overview has an informative and tutorial character and is published for free. All the data, included in the overview, are received from public sources, recognized as more or less reliable. Moreover, there is no guarantee that the indicated information is full and precise. Overviews are not updated. The whole information in each overview, including opinion, indicators, charts and anything else, is provided only for familiarization purposes and is not financial advice or а recommendation. The whole text and its any part, as well as the charts cannot be considered as an offer to make a deal with any asset. IFC Markets and its employees under any circumstances are not liable for any action taken by someone else during or after reading the overview.
