- Analytics
- Technical Analysis
Toyota Motor Technical Analysis - Toyota Motor Trading: 2019-05-09
Lower profit expectations bearish for Toyota Motor prices
Toyota Motor lowered its profit forecast for 2019. Will the Toyota Motor price continue declining?
Toyota Motor lowered its profit forecast to 3.3% rise, amounting to 2.55 trillion yen ($23.20 billion) in the year to March 2020, on an expected drop in revenue and weaker vehicle sales in Japan and North America. A week before that Toyota and Fiat Chrysler Automobiles reported a fall in US auto sales for April. Rising prices, higher interest rates and reduced incentives for buyers were cited as reasons for lower sales. Toyota particularly reported a 4.4% percent fall in US sales in April, noting weak demand for its sedans. Lower demand forecast for cars is bearish for Toyota Motor stock price.
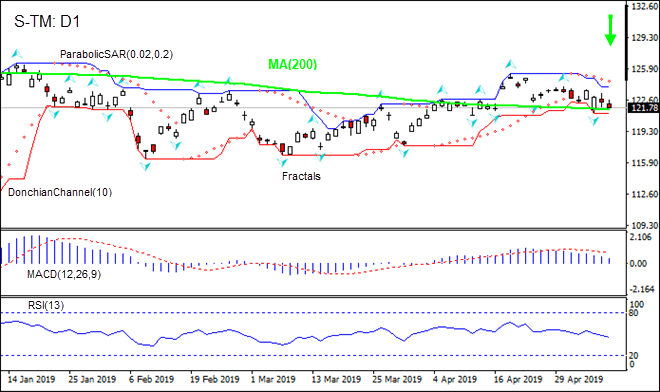
On the daily timeframe the S-TM: D1 is testing the 200-day moving average MA(200), which is falling. This is bearish.
- The Parabolic indicator gives a sell signal.
- The Donchian channel indicates no trend yet: it is flat.
- The MACD indicator gives a bearish signal: it is above the signal line and the gap is narrowing.
- The RSI oscillator is falling but has not reached the oversold zone.
We believe the bearish momentum will continue after the price breaches below the lower boundary of Donchian channel at 121.17. This level can be used as an entry point for placing a pending order to sell. The stop loss can be placed above the upper Donchian boundary at 123.96. After placing the order, the stop loss is to be moved every day to the next fractal high, following Parabolic signals. Thus, we are changing the expected profit/loss ratio to the breakeven point. If the price meets the stop loss level (123.96) without reaching the order (121.17), we recommend cancelling the order: the market has undergone internal changes which were not taken into account.
Technical Analysis Summary
| Position | Sell |
| Sell stop | Below 121.17 |
| Stop loss | Above 123.96 |
Explore our
Trading Conditions
- Spreads from 0.0 pip
- 30,000+ Trading Instruments
- Stop Out Level - Only 10%
Ready to Trade?
Open Account Note:
This overview has an informative and tutorial character and is published for free. All the data, included in the overview, are received from public sources, recognized as more or less reliable. Moreover, there is no guarantee that the indicated information is full and precise. Overviews are not updated. The whole information in each overview, including opinion, indicators, charts and anything else, is provided only for familiarization purposes and is not financial advice or а recommendation. The whole text and its any part, as well as the charts cannot be considered as an offer to make a deal with any asset. IFC Markets and its employees under any circumstances are not liable for any action taken by someone else during or after reading the overview.
