- Analytics
- Technical Analysis
USD CAD Technical Analysis - USD CAD Trading: 2017-05-09
Correction of oil prices supported Canadian dollar
In this review, we recommend considering the personal composite instrument (PCI) CAD_Index . It reflects the dynamics of the Canadian dollar against other major world currencies. The PCI may increase, if the Canadian currency begins to strengthen.
Currently, there is not much positive news for the Canadian dollar. On May 5, 2017, it updated its 14-month low against the US dollar. The Canadian currency may strengthen in case of an increase in world oil prices, as well as in case of softening the rhetoric of the US president Donald Trump regarding the North American Free Trade Agreement (NAFTA). Previously, he announced that he was ready to terminate this agreement if they failed to reach an agreement that would be beneficial for everyone. This week the real estate market data will come out in Canada, which may impact the exchange rate.
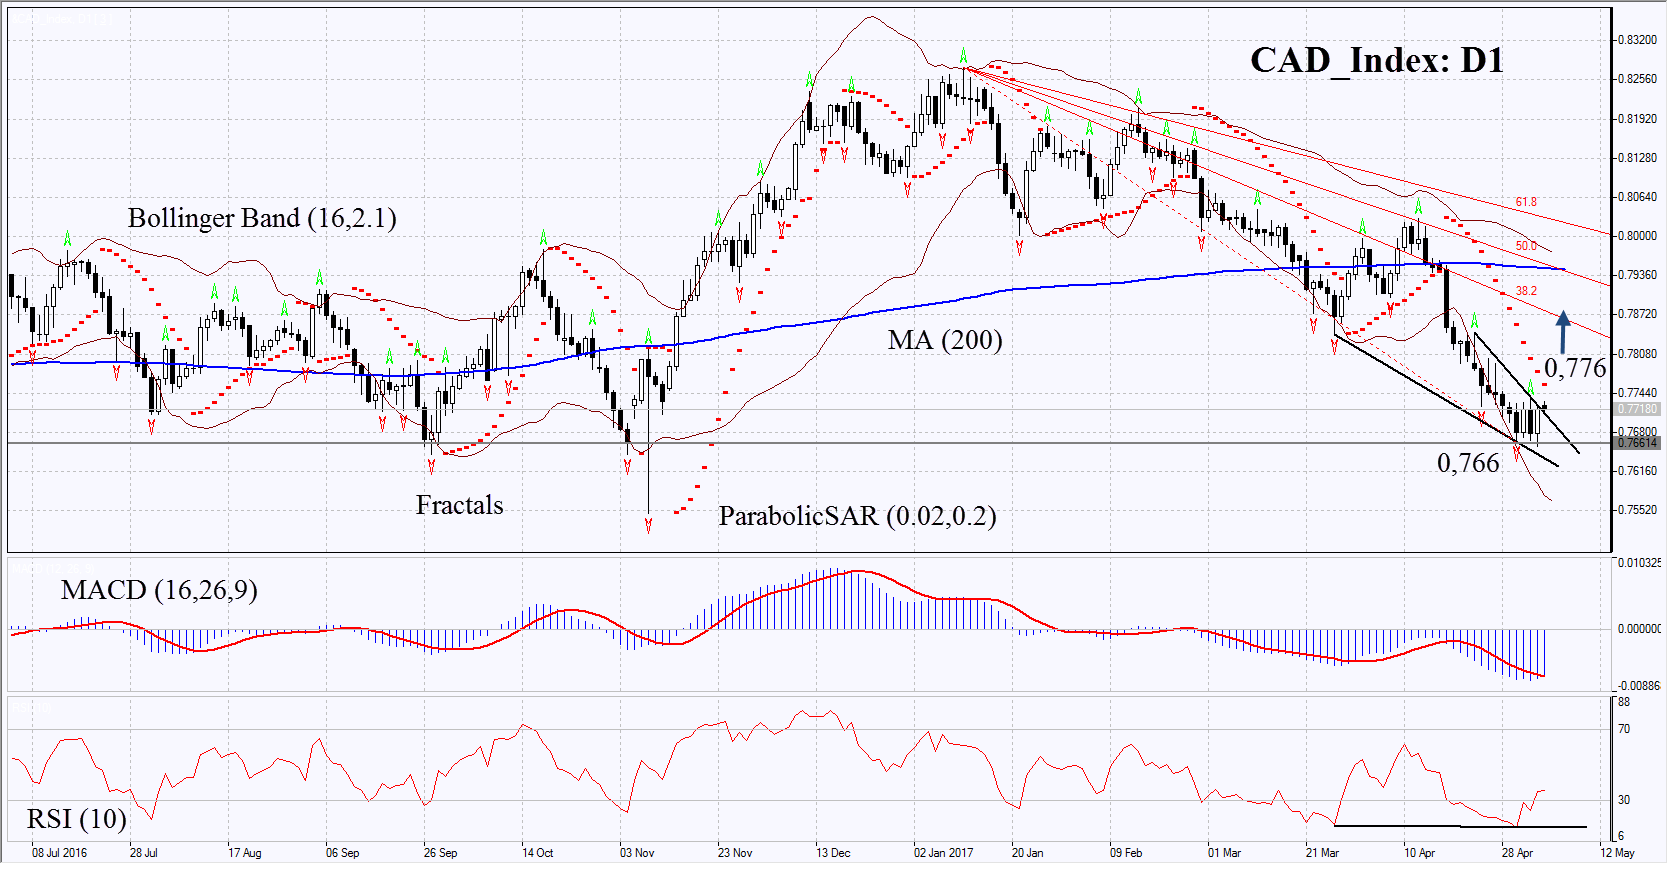
On the daily time frame, CAD_Index: D1 is in a falling trend. Currently, it has slowed down the decline and is trying to correct upwards. In order to open a buy position, it is necessary to wait until the price breaches the resistance line of downtrend. The further PCI growth is possible in case of the strengthening of the Canadian dollar.
- The Parabolic indicator gives a bearish signal. It may be used as an additional resistance level which needs to be overcome to open a buy position.
- The Bollinger bands have markedly widened, which means higher volatility.
- The RSI is below 50. It has formed a weak positive divergence.
- The MACD gives a bullish signal.
The bullish momentum may develop in case CAD_Index exceeds the resistance line of the downtrend, the Parabolic signal and the last fractal high at 0.776. This level may serve as an entry point. The initial stop-loss may be placed below the last low at 0.766. After opening the pending order, we shall move the stop to the next fractal low following the Bollinger and Parabolic signals. Thus, we are changing the potential profit/loss to the breakeven point. More risk-averse traders may switch to the 4-hour chart after the trade and place there a stop-loss moving it in the direction of the trade. If the price meets the stop level at 8.06 without reaching the order at 8.33 we recommend cancelling the position: the market sustains internal changes that were not taken into account.
Summary of technical analysis
| Position | Buy |
| Buy stop | above 0,776 |
| Stop loss | below 0,766 |
Explore our
Trading Conditions
- Spreads from 0.0 pip
- 30,000+ Trading Instruments
- Stop Out Level - Only 10%
Ready to Trade?
Open Account Note:
This overview has an informative and tutorial character and is published for free. All the data, included in the overview, are received from public sources, recognized as more or less reliable. Moreover, there is no guarantee that the indicated information is full and precise. Overviews are not updated. The whole information in each overview, including opinion, indicators, charts and anything else, is provided only for familiarization purposes and is not financial advice or а recommendation. The whole text and its any part, as well as the charts cannot be considered as an offer to make a deal with any asset. IFC Markets and its employees under any circumstances are not liable for any action taken by someone else during or after reading the overview.
