- Analytics
- Technical Analysis
USD CZK Technical Analysis - USD CZK Trading: 2017-08-11
Inflation in the Czech Republic has reached its highest level since November 2012
Inflation in the Czech Republic amounted to 2.5% year-over-year in July 2017 reaching the Czech National Bank (CNB) target level of 2% with a range of plus or minus 1%. Will the correction of the Czech koruna continue?
The inflation has reached its highest level since November 2012. Since early 2017, the koruna has strengthened against the US dollar by 15%. After the publication of the positive US labor market data last Friday, the USDCZK began to correct upwards. This indicates the weakening of the Czech koruna. Also last week, the CNB raised the rate for the first time in 10 years from 0.05 to 0.25%. However, this did not restrain the national currency from a slight weakening. Meanwhile, in the near future a new increase in the CNB rate is not expected. The inflation growth may be an additional negative factor for the Czech koruna, if it does not lead to a rate hike. The next important economic information will be released in the Czech Republic on August 14 - the current account balance and on August 16 - the GDP for Q2.
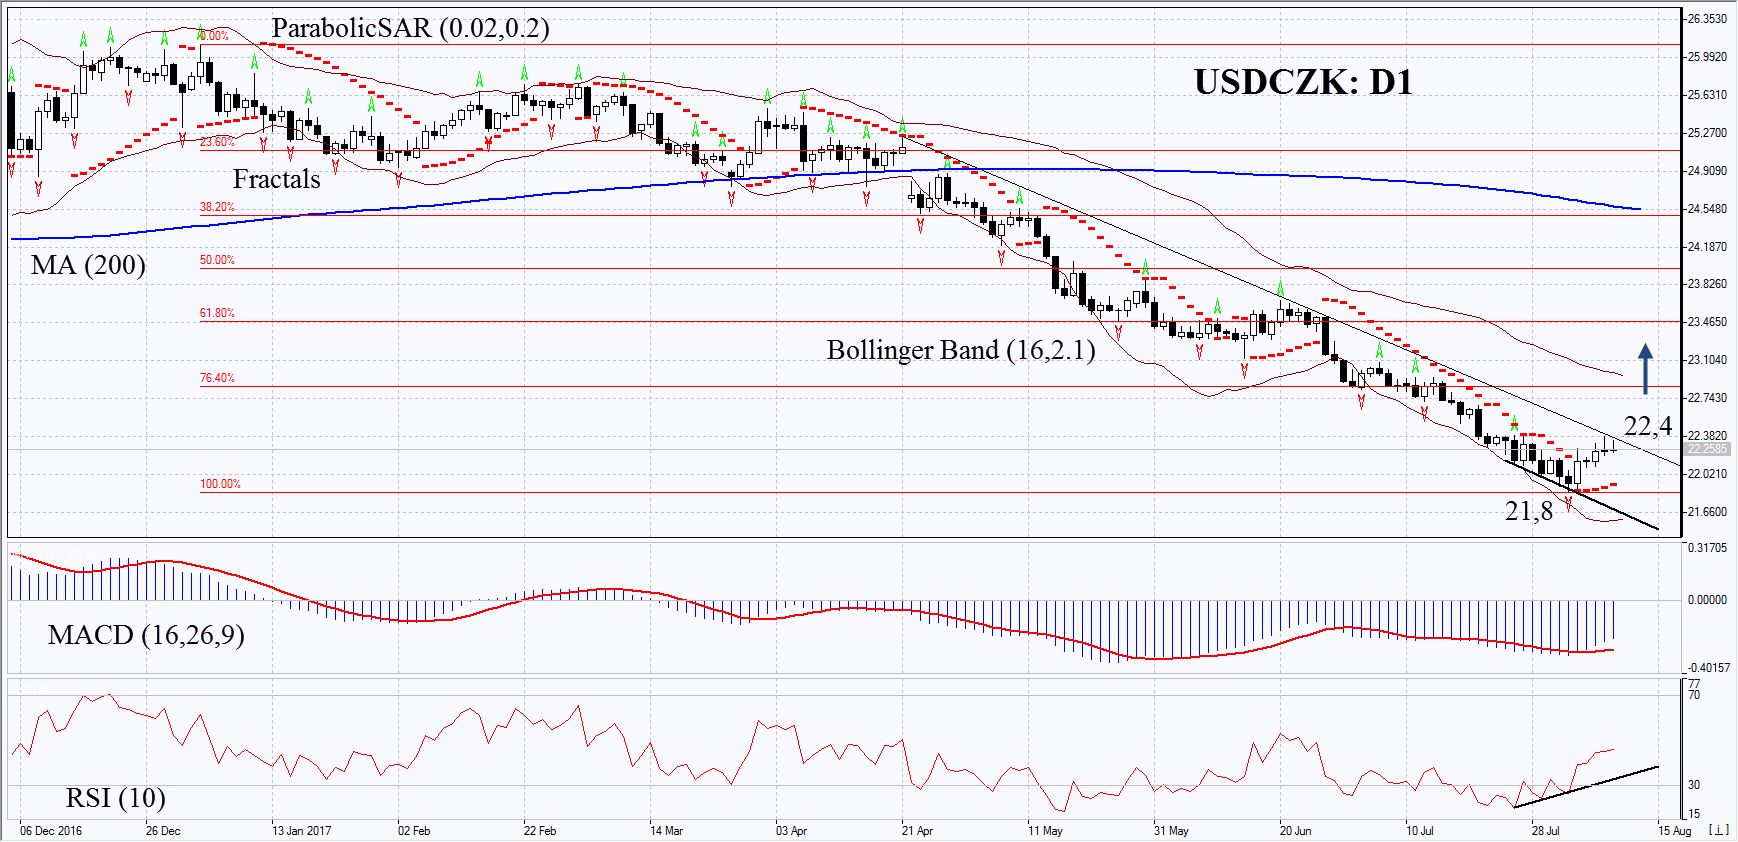
On the daily timeframe, USDCZK: D1 remains in a downtrend. However, its decline has slowed down and a number of technical analysis indicators have formed bullish signals. The further price growth is possible in case of the worsening of the Czech economic conditions and positive economic data in the US.
- The Parabolic indicator gives a bullish signal.
- The Bollinger bands have markedly widened, which means high volatility.
- The RSI indicator reached the oversold zone and started to grow. It is below 50 and has formed a positive divergence.
- The MACD indicator gives a bullish signal.
The bullish momentum may develop in case USDCZK exceeds the last fractal high and the resistance line of a downtrend at 22.4. This level may serve as an entry point. The initial stop loss may be placed below the last fractal low, the 2.5-year low and the Parabolic signal at 21.8. After opening the pending order, we shall move the stop to the next fractal low following the Bollinger and Parabolic signals. Thus, we are changing the potential profit/loss to the breakeven point. More risk-averse traders may switch to the 4-hour chart after the trade and place there a stop loss moving it in the direction of the trade. If the price meets the stop level at 21.8 without reaching the order at 22.4 we recommend cancelling the position: the market sustains internal changes that were not taken into account.
Summary of technical analysis
| Position | Buy |
| Buy stop | above 22,4 |
| Stop loss | below 21,8 |
Explore our
Trading Conditions
- Spreads from 0.0 pip
- 30,000+ Trading Instruments
- Stop Out Level - Only 10%
Ready to Trade?
Open Account Note:
This overview has an informative and tutorial character and is published for free. All the data, included in the overview, are received from public sources, recognized as more or less reliable. Moreover, there is no guarantee that the indicated information is full and precise. Overviews are not updated. The whole information in each overview, including opinion, indicators, charts and anything else, is provided only for familiarization purposes and is not financial advice or а recommendation. The whole text and its any part, as well as the charts cannot be considered as an offer to make a deal with any asset. IFC Markets and its employees under any circumstances are not liable for any action taken by someone else during or after reading the overview.
