- Analytics
- Technical Analysis
USD JPY Technical Analysis - USD JPY Trading: 2016-11-03
Safe-haven currencies are in high demand given risks in US
According to the International Business Times, candidate for presidency Donald Trump has overcome his rival Hillary Clinton by 1% in three hesitating states: Florida, Iowa and Ohio. This raised political risks and pushed US dollar lower. Amid this safe-haven currencies are in demand, especially yen and Swiss franc. Will yen continue strengthening?
BoJ left the rate unchanged at -0.1% and other parameters of monetary policy also remained unaltered in course of the Bank’s meeting on Tuesday. At the same time, it extended the period for reaching the 2% inflation target. Previously yen was weakening on investors’ worries that BoJ may introduce additional economic stimulus by cutting rate further into negative and raising limits of quantitative easing. As we see, this did not occur. The period for inflation to rise has been extended and now surpasses the term limit of BoJ president Haruhiko Kuroda which expires in 2018. Some market participants believe the Japanese regulator is not planning to ease monetary policy till that. The next BoJ meeting is scheduled on December 20, 2016. We believe the current account balance for September and Q3 GDP may weigh on yen. They will be released on November 8 and 13 respectively. The tentative outlook is positive.
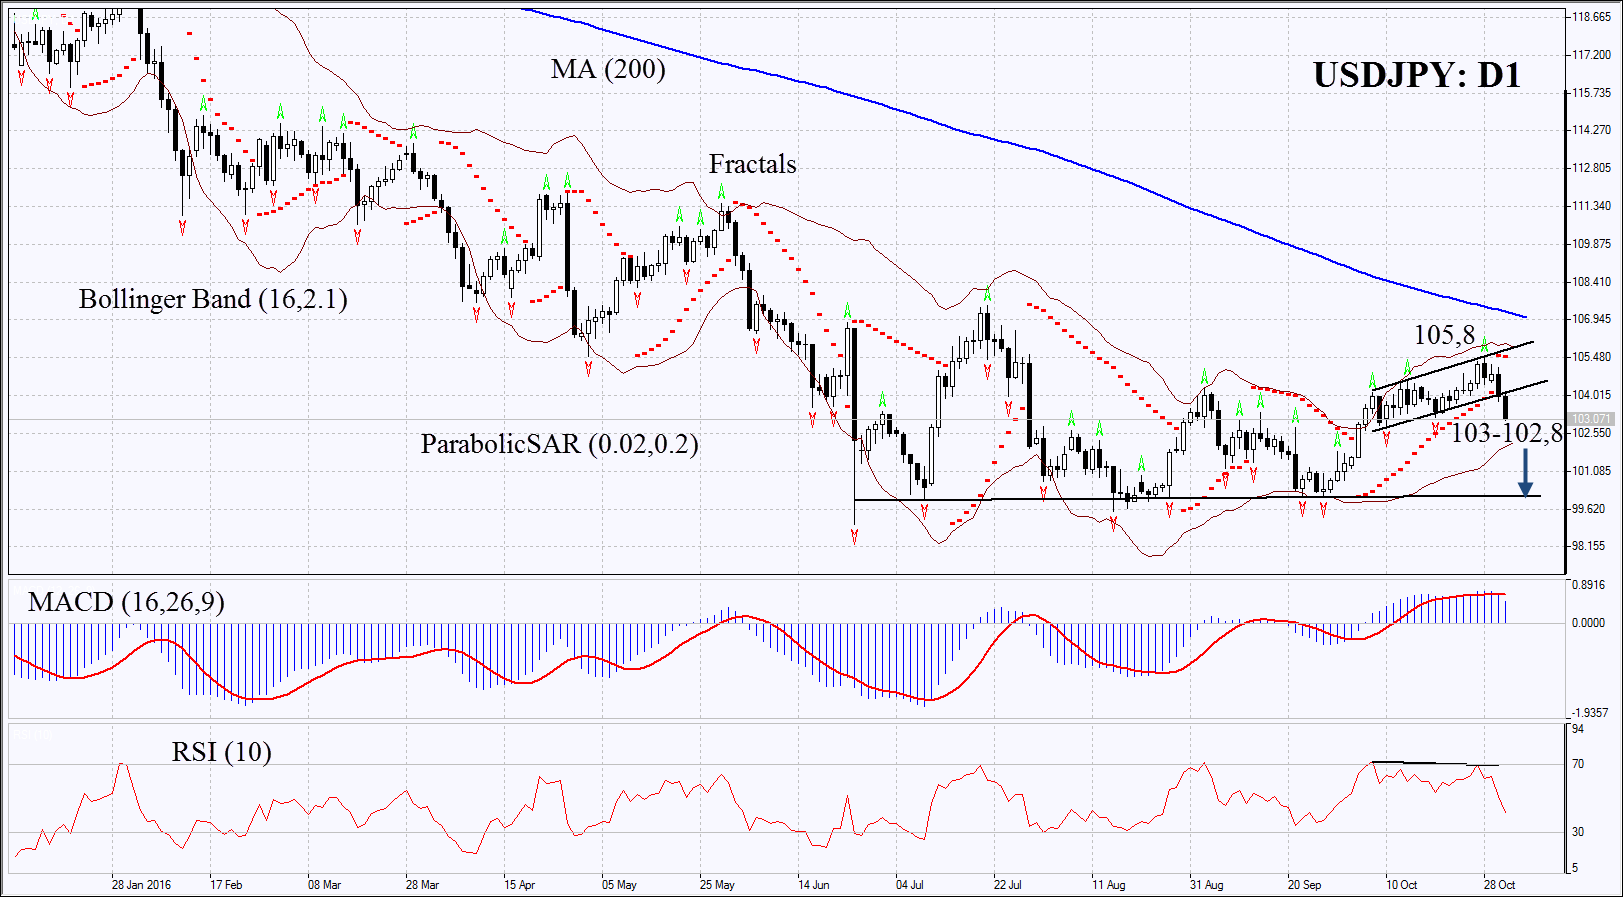
On the daily chart USDJPY: D1 has left the rising channel to more downwards. Its further decline is possible in case of higher political risks ahead of US presidential elections on November 8 and in case of weak economic indicators cone out in Japan next week.
- Parabolic is giving bearish signals.
- Bollinger bands have narrowed which means lower volatility.
- RSI has fallen below 50 but has not yet reached the overbought zone. It has formed negative divengence.
- MACD is giving signals to sell.
The bearish momentum may develop in case the Japanese yen falls below the two last fractal lows at 103-102,8. This level may serve the point of entry. The initial stop-loss may be placed above the Parabolic signal and the last fractal high. Having opened the pending order we shall move the stop to the next fractal high following the Parabolic and Bollinger signals. Thus, we are changing the probable profit/loss ratio to the breakeven point. The most risk-averse traders may switch to the 4-hour chart after the trade and place there a stop-loss moving it in the direction of the trade. If the price meets the stop-loss level at 105.8 without reaching the order at 102.8, we recommend cancelling the position: the market sustains internal changes which were not taken into account.
Summary of technical analysis
| Position | Sell |
| Sell stop | below 103-102.8 |
| Stop loss | above 105.8 |
Explore our
Trading Conditions
- Spreads from 0.0 pip
- 30,000+ Trading Instruments
- Stop Out Level - Only 10%
Ready to Trade?
Open Account Note:
This overview has an informative and tutorial character and is published for free. All the data, included in the overview, are received from public sources, recognized as more or less reliable. Moreover, there is no guarantee that the indicated information is full and precise. Overviews are not updated. The whole information in each overview, including opinion, indicators, charts and anything else, is provided only for familiarization purposes and is not financial advice or а recommendation. The whole text and its any part, as well as the charts cannot be considered as an offer to make a deal with any asset. IFC Markets and its employees under any circumstances are not liable for any action taken by someone else during or after reading the overview.
