- Analytics
- Technical Analysis
USD JPY Technical Analysis - USD JPY Trading: 2019-09-04
Industrial activity declines in Japan
In August, manufacturing activity in Japan declined four months in a row. Is the weakening of Japanese Yen possible?
The macroeconomic indicator Jibun Bank Japan Manufacturing Purchasing Managers' Index (PMI) in August fell to 49.3 points. For 4 months now, it has been below 50 points, which means a decrease in activity in the industry. The last time such a long negative period was observed in Japan in 2016. An additional negative for the yen could be the normalization and mutual concessions in trade relations between China and the United States during the planned negotiations. Investors previously viewed the yen as a defensive asset, which largely determined its strengthening.
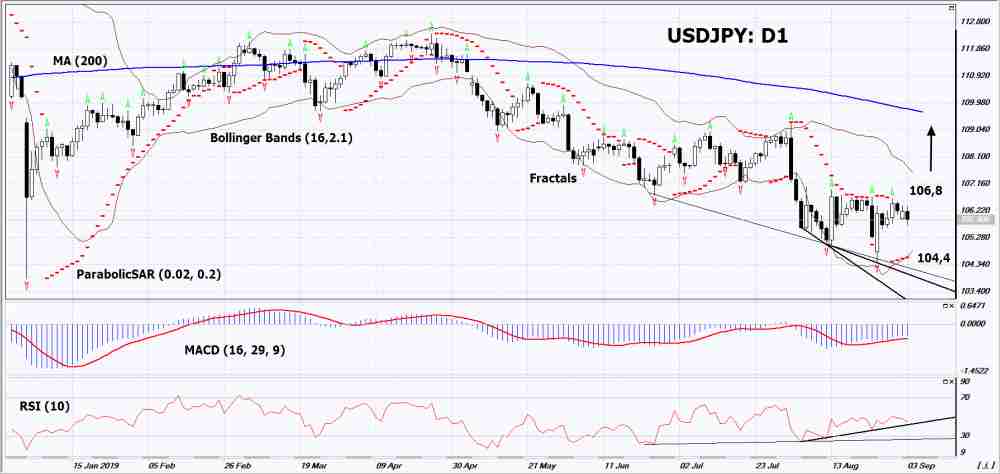
On the daily timeframe USDJPY: D1 is in a downtrend. At the same time, the decline slowed down and various technical analysis indicators formed upward reversal signals. Further growth of quotations is possible if negative macroeconomic data will be published in Japan and positive in the USA, as well as normalization of US-Chinese foreign trade relations.
- The Parabolic indicator demonstrates a signal to increase.
- The Bolinger bands narrowed, indicating volatility decrease. The bottom line has a slope up.
- The RSI indicator is below the 50 mark. It has formed several divergences to increase.
- The MACD indicator demonstrates a downtrend signal.
The bullish momentum may develop if USDJPY exceeds two upper fractals: 106.8. This level can be used as an entry point. Initial stop lose may be placed below the last lower fractal, Parabolic signal and the lower Bollinger line: 104.4. After opening the pending order, the stop shall be moved following the Bollinger and Parabolic signals to the next fractal minimum. Thus, we are changing the potential profit/loss to the breakeven point. More risk-averse traders may switch to the 4-hour chart after the trade and place a stop loss moving it in the direction of the trade. If the price meets the stop level (104,4) without reaching the order (106,8), we recommend to cancel the order: the market sustains internal changes that were not taken into account.
Technical Analysis Summary
| Position | Buy |
| Buy stop | Above 106,8 |
| Stop loss | Below 104,4 |
Explore our
Trading Conditions
- Spreads from 0.0 pip
- 30,000+ Trading Instruments
- Stop Out Level - Only 10%
Ready to Trade?
Open Account Note:
This overview has an informative and tutorial character and is published for free. All the data, included in the overview, are received from public sources, recognized as more or less reliable. Moreover, there is no guarantee that the indicated information is full and precise. Overviews are not updated. The whole information in each overview, including opinion, indicators, charts and anything else, is provided only for familiarization purposes and is not financial advice or а recommendation. The whole text and its any part, as well as the charts cannot be considered as an offer to make a deal with any asset. IFC Markets and its employees under any circumstances are not liable for any action taken by someone else during or after reading the overview.
