- Analytics
- Technical Analysis
USD NOK Technical Analysis - USD NOK Trading: 2017-08-10
Norway economy lags behind in growth
The Norway economic indicators look weaker than those in Europe and the US. Will the Norwegian krone weaken?
The Norway economy increased by 0.2% year-over-year according to the Q2 results. In the Eurozone, the GDP growth was significantly higher and amounted to 2.1%, while in the US – 2.6%. At the same time, the July inflation in Norway was relatively high and reached 1.9% year-over-year. In the US, it was lower and amounted to 1.6%, while in the Eurozone – 1.3%. The Norway Central Bank interest rate is 0.5%, which is less than in the US, but more than in the Eurozone. At the end of July 2017, the Norwegian krone strengthened against the US dollar and the USDNOK reached a 2-year low. A small correction is possible due to the difference in economic indicators.
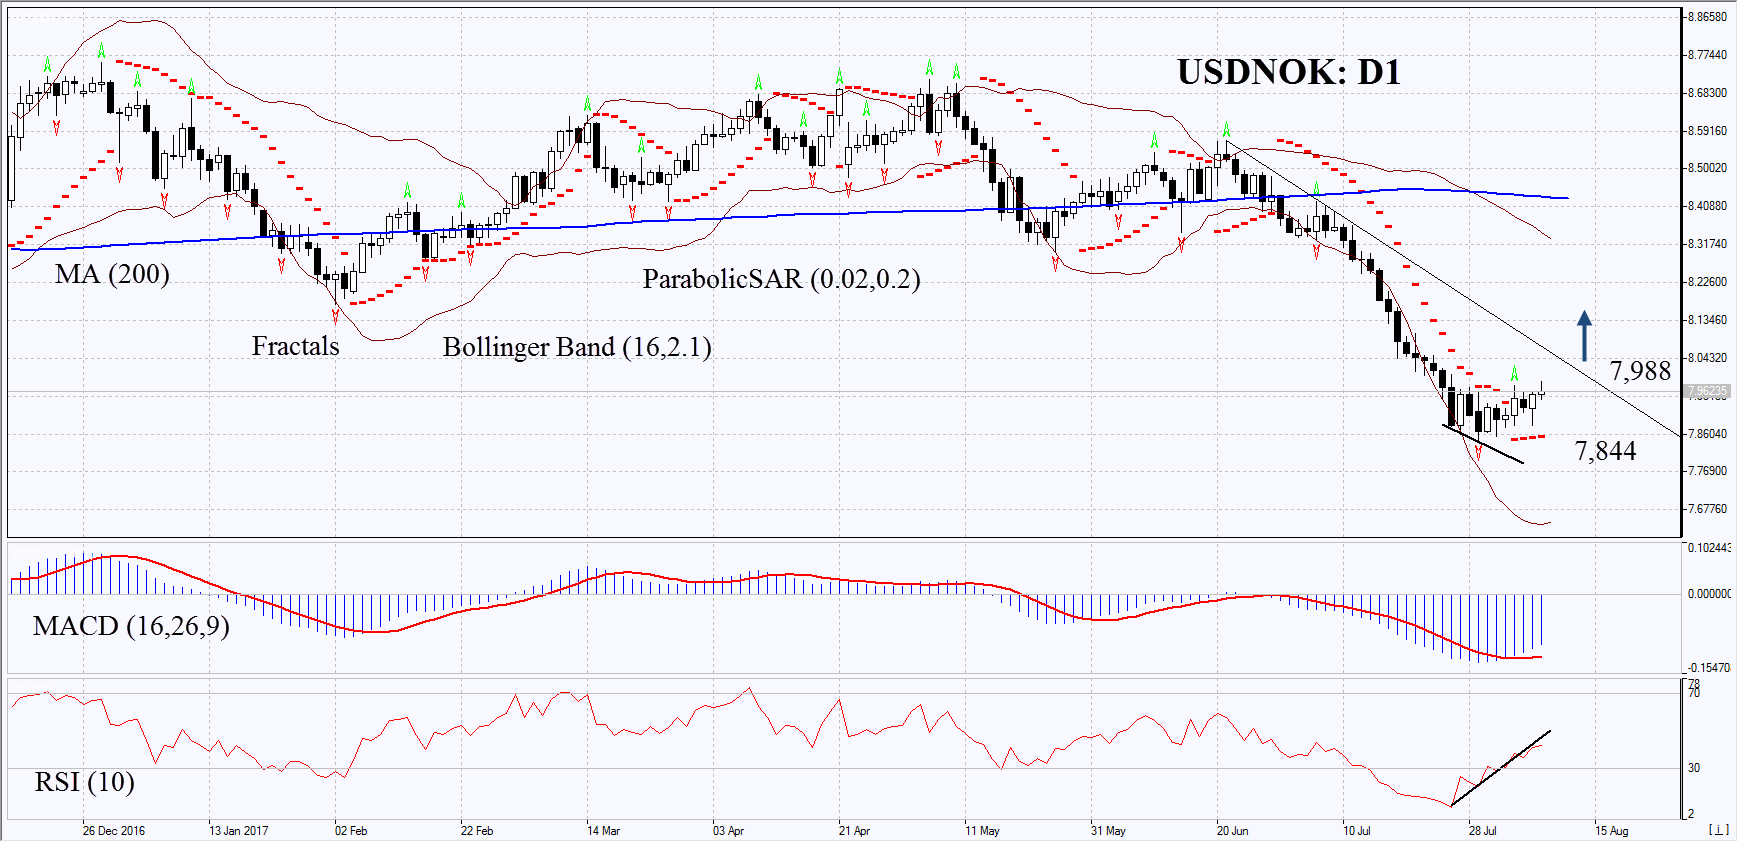
On the daily timeframe, USDNOK: D1 remains in the downtrend. However, its decline has slowed down and a number of technical analysis indicators have formed bullish signals. The further price growth is possible in case of the worsening of the Norwegian economic conditions and good economic data in the US.
- The Parabolic indicator gives a bullish signal.
- The Bollinger bands have markedly widened, which means high volatility.
- The RSI indicator reached the oversold zone and started to grow. It is below 50 and has formed a positive divergence.
- The MACD indicator gives a bullish signal.
The bullish momentum may develop in case USDNOK exceeds the Wednesday high at 7.988. This level may serve as an entry point. The initial stop loss may be placed below the last fractal low, the 2-year low and the Parabolic signal at 7.844. After opening the pending order, we shall move the stop to the next fractal low following the Bollinger and Parabolic signals. Thus, we are changing the potential profit/loss to the breakeven point. More risk-averse traders may switch to the 4-hour chart after the trade and place there a stop loss moving it in the direction of the trade. If the price meets the stop level at 7.844 without reaching the order at 7.988 we recommend cancelling the position: the market sustains internal changes that were not taken into account.
Summary of technical analysis
| Position | Buy |
| Buy stop | above 7,988 |
| Stop loss | below 7,844 |
Explore our
Trading Conditions
- Spreads from 0.0 pip
- 30,000+ Trading Instruments
- Stop Out Level - Only 10%
Ready to Trade?
Open Account Note:
This overview has an informative and tutorial character and is published for free. All the data, included in the overview, are received from public sources, recognized as more or less reliable. Moreover, there is no guarantee that the indicated information is full and precise. Overviews are not updated. The whole information in each overview, including opinion, indicators, charts and anything else, is provided only for familiarization purposes and is not financial advice or а recommendation. The whole text and its any part, as well as the charts cannot be considered as an offer to make a deal with any asset. IFC Markets and its employees under any circumstances are not liable for any action taken by someone else during or after reading the overview.
