- Analytics
- Technical Analysis
US Dollar Index Technical Analysis - US Dollar Index Trading: 2017-08-07
The US labor market data turned out to be positive
On Friday, positive data on the US labor market for July, 2017 were published in the US. Will the quotes of the US dollar index rise?
The number of Nonfarm payrolls was 209 thousand. This is much higher than the forecast of 180 thousand. The June indicator was revised upwards to 231 thousand from 222 thousand. The average hourly wage rose by 0.3% compared with June, which is the highest increase in 5 months. In annual terms, its growth was 2.5% and exceeded the inflation of 1.6% in July year-on-year. The US unemployment in July fell to 4.3% from 4.4% in June. Currently it is at a 16-year low. The US foreign trade data also turned out to be positive. The June trade deficit fell more than expected. After the Friday publication of economic data, the probability of a Fed rate hike in December, 2017 increased to 50%. On Thursday, it was only 44%.
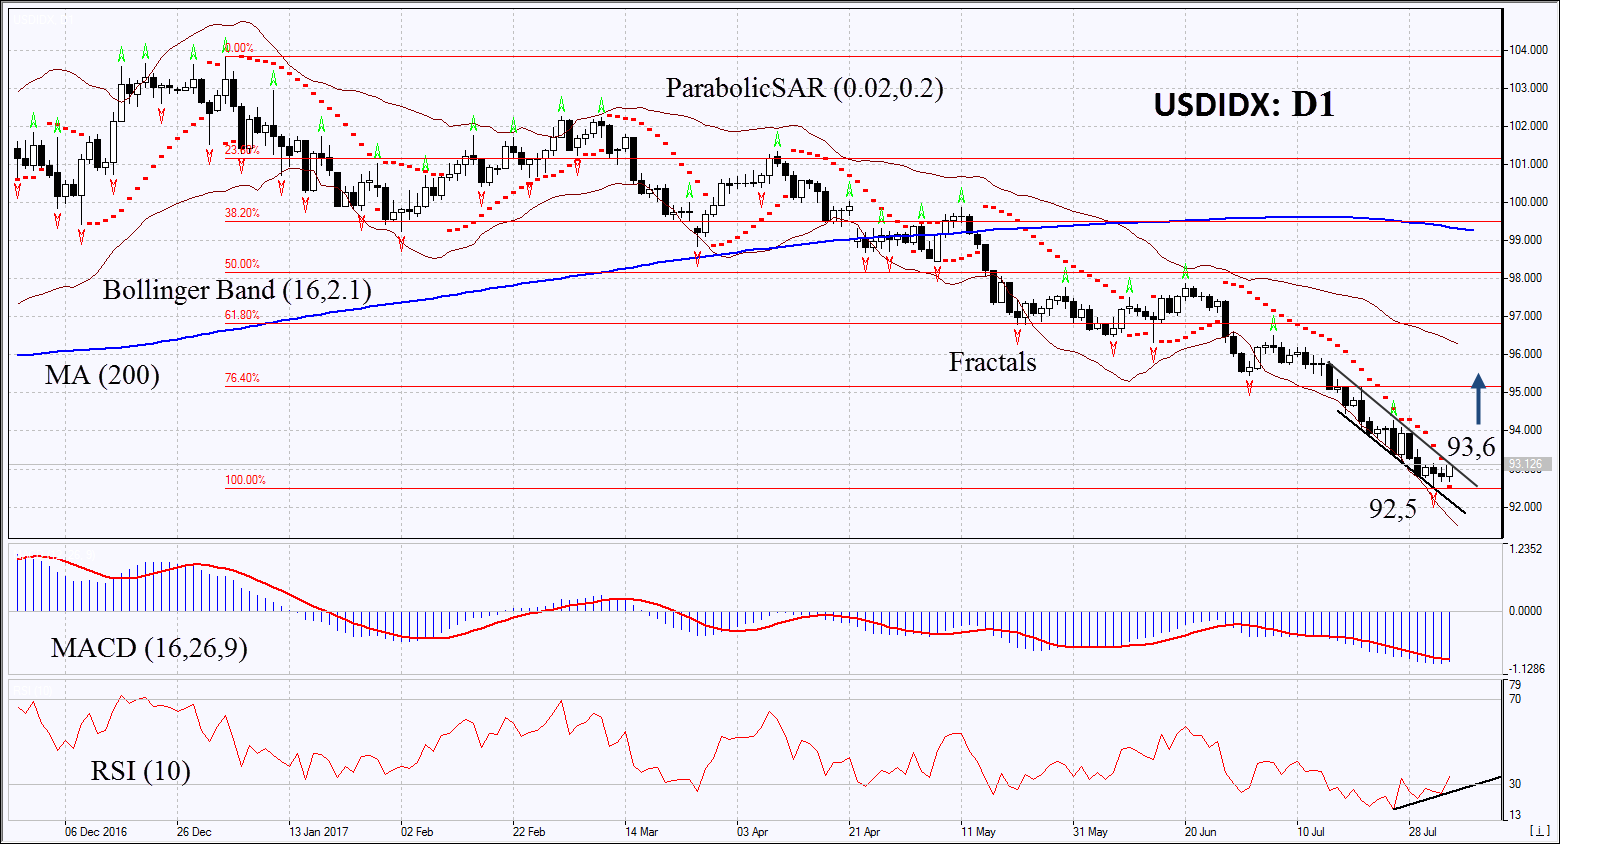
On the daily timeframe, USDIDX: D1 remains in the downtrend. However, its growth has slowed down and a number of technical analysis indicators have formed bullish signals. The further price increase is possible in case of the improvement of the US economic state and the growth in the probability of the Fed rate hike.
- The Parabolic indicator gives a bullish signal.
- The Bollinger bands have markedly widened, which means higher volatility.
- The RSI indicator reached the oversold zone and started to grow. It has formed a positive divergence.
- The MACD indicator still gives a bearish signal.
The bearish momentum may develop in case USDIDX exceeds the resistance line of the downtrend at 93.6. This level may serve as an entry point. The initial stop loss may be placed below the last fractal low, the 15-month low and the Parabolic signal at 92.5. After opening the pending order, we shall move the stop to the next fractal low following the Bollinger and Parabolic signals. Thus, we are changing the potential profit/loss to the breakeven point. More risk-averse traders may switch to the 4-hour chart after the trade and place there a stop loss moving it in the direction of the trade. If the price meets the stop level at 92.5 without reaching the order at 93.6 we recommend cancelling the position: the market sustains internal changes that were not taken into account.
Summary of technical analysis
| Position | Buy |
| Buy stop | above 93,6 |
| Stop loss | below 92,5 |
Explore our
Trading Conditions
- Spreads from 0.0 pip
- 30,000+ Trading Instruments
- Stop Out Level - Only 10%
Ready to Trade?
Open Account Note:
This overview has an informative and tutorial character and is published for free. All the data, included in the overview, are received from public sources, recognized as more or less reliable. Moreover, there is no guarantee that the indicated information is full and precise. Overviews are not updated. The whole information in each overview, including opinion, indicators, charts and anything else, is provided only for familiarization purposes and is not financial advice or а recommendation. The whole text and its any part, as well as the charts cannot be considered as an offer to make a deal with any asset. IFC Markets and its employees under any circumstances are not liable for any action taken by someone else during or after reading the overview.
