- Analytics
- Technical Analysis
Wheat Ruble Technical Analysis - Wheat Ruble Trading: 2017-05-02
Bad weather increases wheat prices
In this review, we recommend considering the personal composite instrument (PCI) Wheat against the Ruble. It reflects the dynamics of wheat prices against the Russian ruble. The PCI may increase if the ruble weakens, and the wheat price, expressed in US dollars - grows.
On Monday, snowstorm was observed in the main agricultural regions of the US. In particular, it affected western Kansas, the southeastern part of Colorado and Oklahoma. Cold weather and freeze may strongly damage the wheat crop in the US. On the contrary, severe drought is observed on the territory of Europe, which also greatly damages wheat plantings. Last week, the French agency FranceAgriMer cut their “good and excellent” ratings to 78% from 85%. Note that according to the US Commodity Futures Trading Commission, the net short contracts on wheat on the Chicago Board of Trade (CBOT) reached a historic high. If speculators start closing short positions, this may become an additional source for the growth of wheat prices.
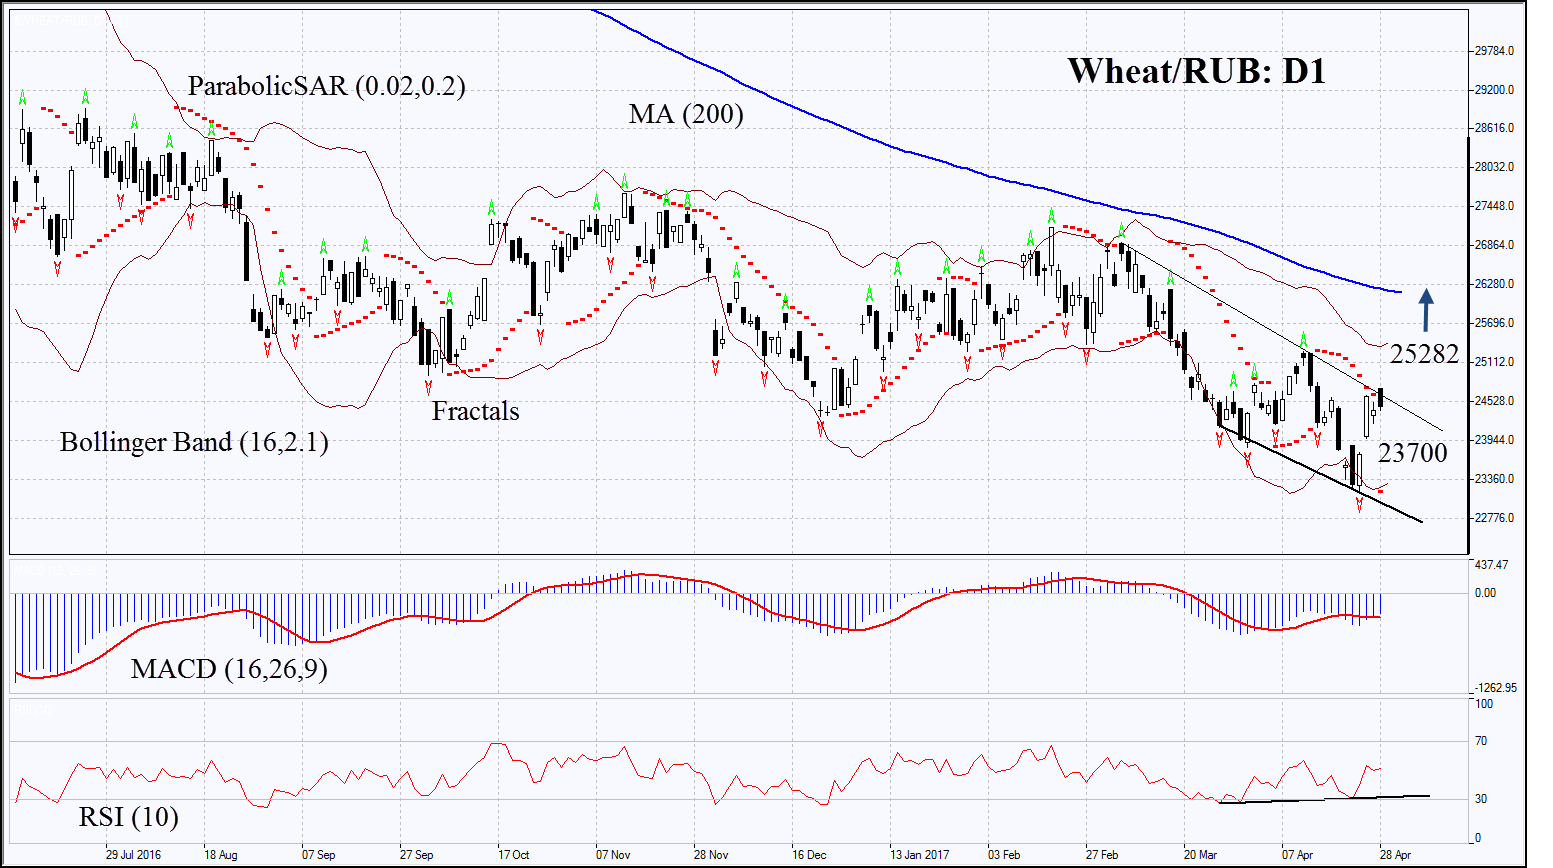
On the daily time frame, WHEAT/RUB: D1 is in a falling trend. Currently, it is trying to correct upwards. In order to open a buy position, it is necessary to wait for the overcoming of the resistance line of the downtrend. The further PCI growth is possible if the ruble weakens, while the wheat increases in price.
- The Parabolic indicator gives a bullish signal.
- The Bollinger bands show high volatility. They are tilted upwards.
- The RSI indicator is above 50. It has formed a positive divergence.
- The MACD indicator gives a bullish signal.
The bullish momentum may develop in case WHEAT/RUB exceeds the resistance line of the downtrend and the last fractal high at 25282. This level may serve as an entry point. The initial stop-loss may be placed below the last gap (price gap) at 23700. After opening the pending order, we shall move the stop to the next fractal low following the Bollinger and Parabolic signals. Thus, we are changing the potential profit/loss to the breakeven point. More risk-averse traders may switch to the 4-hour chart after the trade and place there a stop-loss moving it in the direction of the trade. If the price meets the stop level at 8.06 without reaching the order at 8.33 we recommend cancelling the position: the market sustains internal changes that were not taken into account.
Summary of technical analysis
| Position | Buy |
| Buy stop | above 25282 |
| Stop loss | below 23700 |
Explore our
Trading Conditions
- Spreads from 0.0 pip
- 30,000+ Trading Instruments
- Stop Out Level - Only 10%
Ready to Trade?
Open Account Note:
This overview has an informative and tutorial character and is published for free. All the data, included in the overview, are received from public sources, recognized as more or less reliable. Moreover, there is no guarantee that the indicated information is full and precise. Overviews are not updated. The whole information in each overview, including opinion, indicators, charts and anything else, is provided only for familiarization purposes and is not financial advice or а recommendation. The whole text and its any part, as well as the charts cannot be considered as an offer to make a deal with any asset. IFC Markets and its employees under any circumstances are not liable for any action taken by someone else during or after reading the overview.
