- Analytics
- Technical Analysis
Silver Technical Analysis - Silver Trading: 2018-08-06
Euro may fall because of the difference in the ECB and Fed rates
In this review, we will consider the trading instrument silver against the euro. Will XAGEUR prices rise? An upward movement occurs when silver rises, while the euro weakens.
According to the results of the European Central Bank meeting on July 26, 2018, its head, Mario Draghi, said that the ECB will continue the ultra-loose monetary policy, despite the fact that inflation in the Eurozone is approaching the 2% target level. A rate hike from the current zero level is possible not earlier than the summer of 2019. At the same time, the ECB will continue to issue euros in the amount of 2.6 trillion euros per year with the aim of stimulating the EU economy (quantitative easing). Such measures can prevent the long-term strengthening of the single currency. At its meeting on August 1, 2018, the US Fed did not raise the rate, but noted the steady development of the US economy. According to the FedWatch service data, the probability of a rate hike at the meeting on September 26 is 90%. This may contribute to the EURUSD decrease. In turn, the demand for silver may increase, as amid risks of trade wars, many countries increase the share of precious metals in their international reserves.
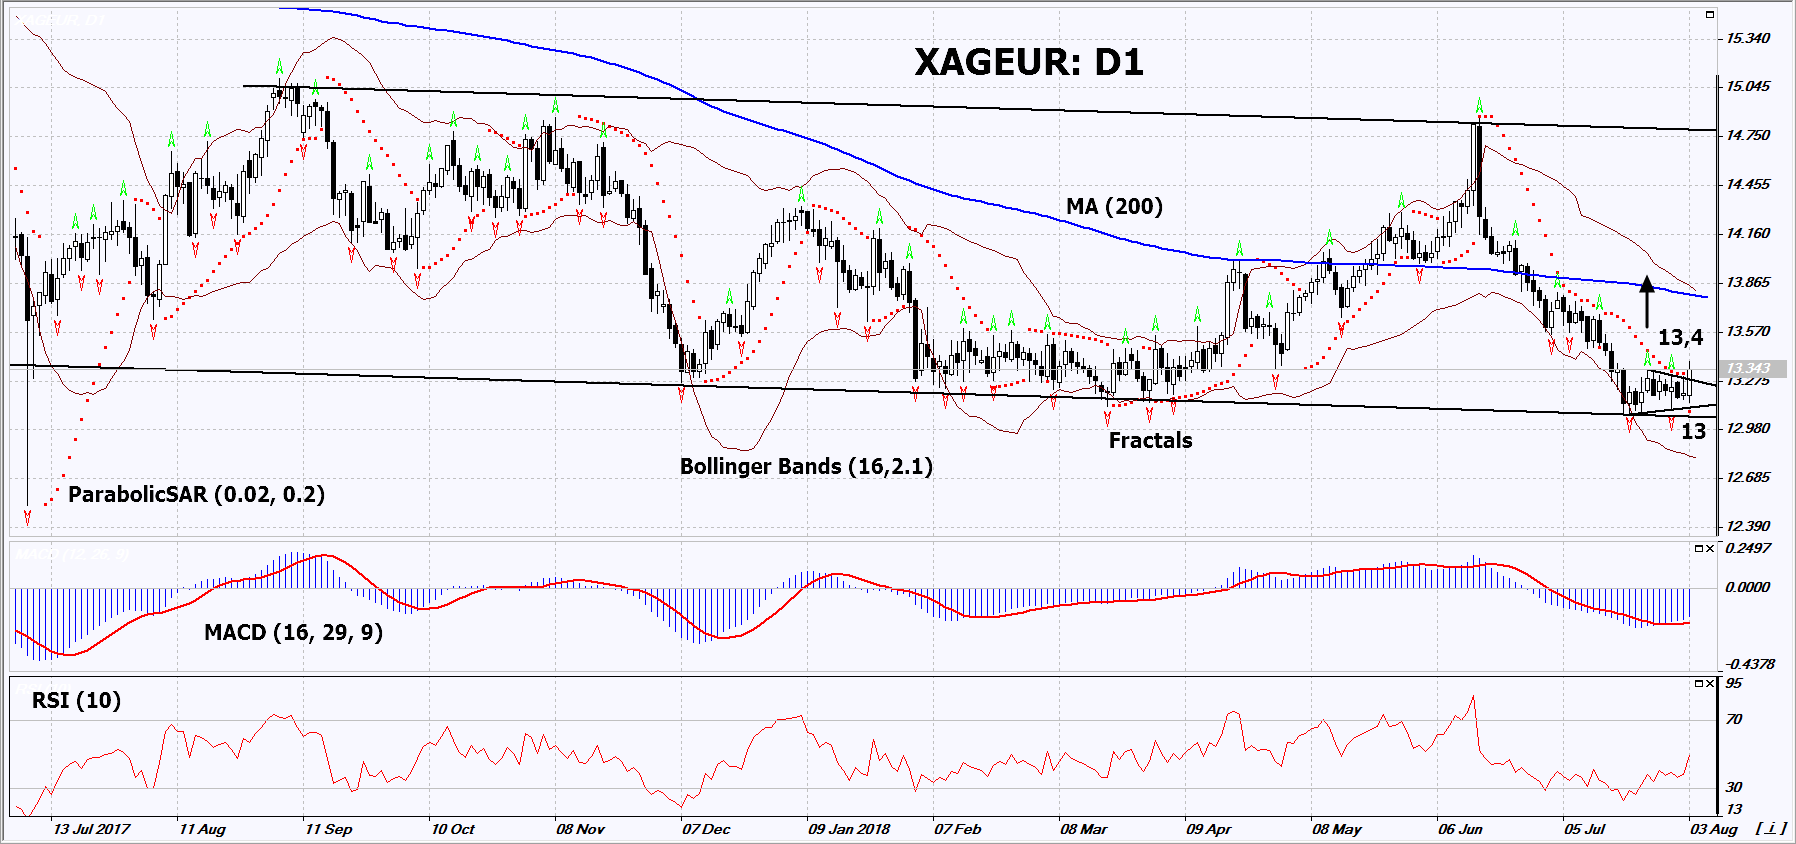
On the daily timeframe, XAGEUR: D1 approached the support line of the long-term neutral range. After that, it moved upward from the triangle. A number of technical analysis indicators formed buy signals. The further price increase is possible in case of an increase in the world demand for precious metals and negative economic data in the Eurozone.
- The Parabolic indicator gives a bullish signal.
- The Bollinger bands have widened, which indicates high volatility.
- The RSI indicator is below 50. No divergence.
- The MACD indicator gives a bullish signal.
The bullish momentum may develop in case XAGEUR exceeds its last high at 13.4. This level may serve as an entry point. The initial stop loss may be placed below the last fractal low, the 13-month low and the Parabolic signal at 13. After opening the pending order, we shall move the stop to the next fractal low following the Bollinger and Parabolic signals. Thus, we are changing the potential profit/loss to the breakeven point. More risk-averse traders may switch to the 4-hour chart after the trade and place there a stop loss moving it in the direction of the trade. If the price meets the stop level (13) without reaching the order (13.4), we recommend to close the position: the market sustains internal changes that were not taken into account.
Summary of technical analysis
| Position | Buy |
| Buy stop | Above 13.4 |
| Stop loss | Below 13 |
Explore our
Trading Conditions
- Spreads from 0.0 pip
- 30,000+ Trading Instruments
- Stop Out Level - Only 10%
Ready to Trade?
Open Account Note:
This overview has an informative and tutorial character and is published for free. All the data, included in the overview, are received from public sources, recognized as more or less reliable. Moreover, there is no guarantee that the indicated information is full and precise. Overviews are not updated. The whole information in each overview, including opinion, indicators, charts and anything else, is provided only for familiarization purposes and is not financial advice or а recommendation. The whole text and its any part, as well as the charts cannot be considered as an offer to make a deal with any asset. IFC Markets and its employees under any circumstances are not liable for any action taken by someone else during or after reading the overview.
