- Analytics
- Technical Analysis
XAUUSD Technical Analysis - XAUUSD Trading: 2019-02-28
US-China trade negotiations may be prolonged
Gold prices are falling amid difficulties in US-China trade negotiations and the strengthening of the US dollar. Will the XAUUSD continue to fall?
The US representative in trade negotiations with China Robert Lighthizer said that the US should maintain the threat of increasing duties on Chinese goods for many years, even if the trade agreement is signed. He also noted that much work needs to be done in this direction. Market participants have decided that the US will demand more comfortable conditions for mutual trade. This contributed to the strengthening of the US dollar. Let us recall that US President Donald Trump was going to increase import duties on Chinese goods from March 1 to 25% from 10%, totaling $200 billion a year. The dates have been postponed, as the leaders of the United States and China are going to meet and discuss the existing problems. Dollar and gold prices, as a rule, move in anti-phase (in opposite directions), as investors consider them as alternatives to each other.
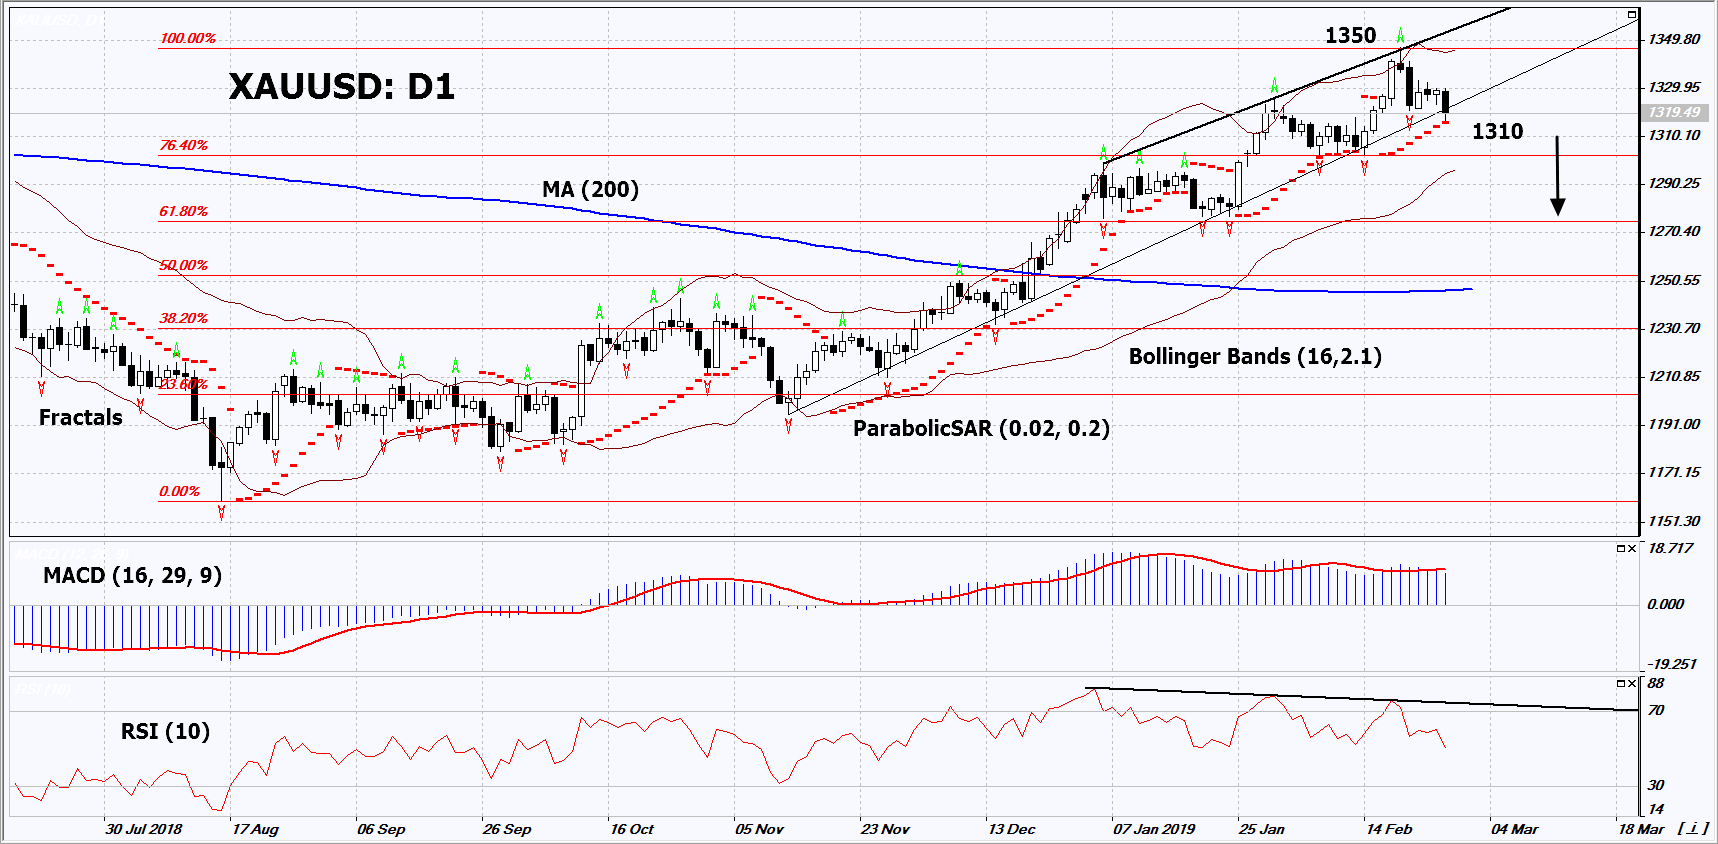
On the daily timeframe, XAUUSD: D1 is trying to breach down the support line of the uptrend. Most technical analysis indicators formed sell signals. A downward correction is possible in case of the strengthening of the US currency.
- The Parabolic Indicator gives a bullish signal. It can be used as an additional support level, which should be overcome before opening a sell position.
- The Bollinger bands have narrowed, which indicates low volatility. The upper band is titled down.
- The RSI indicator is near 50. It has formed double negative divergence.
- The MACD indicator gives a bearish signal.
The bearish momentum may develop in case XAUUSD falls below the Parabolic signal at 1310. This level may serve as an entry point. The initial stop loss may be placed above the last fractal high, the high since April 2018 and the upper Bollinger band at 1350. After opening the pending order, we shall move the stop to the next fractal low following the Bollinger and Parabolic signals. Thus, we are changing the potential profit/loss to the breakeven point. More risk-averse traders may switch to the 4-hour chart after the trade and place there a stop loss moving it in the direction of the trade. If the price meets the stop level (1350) without reaching the order (1310), we recommend to close the position: the market sustains internal changes that were not taken into account.
Summary of technical analysis
| Position | Sell |
| Sell stop | Below 1310 |
| Stop loss | Above 1350 |
Explore our
Trading Conditions
- Spreads from 0.0 pip
- 30,000+ Trading Instruments
- Stop Out Level - Only 10%
Ready to Trade?
Open Account Note:
This overview has an informative and tutorial character and is published for free. All the data, included in the overview, are received from public sources, recognized as more or less reliable. Moreover, there is no guarantee that the indicated information is full and precise. Overviews are not updated. The whole information in each overview, including opinion, indicators, charts and anything else, is provided only for familiarization purposes and is not financial advice or а recommendation. The whole text and its any part, as well as the charts cannot be considered as an offer to make a deal with any asset. IFC Markets and its employees under any circumstances are not liable for any action taken by someone else during or after reading the overview.
