- Ausbildung
- Technische Analyse
- Technische Indikatoren
- Indikatoren von Bill Williams
- Acceleration / Deceleration Oszillator
Acceleration / Deceleration Oszillator
Gebrauchsanweisung für Accelerator
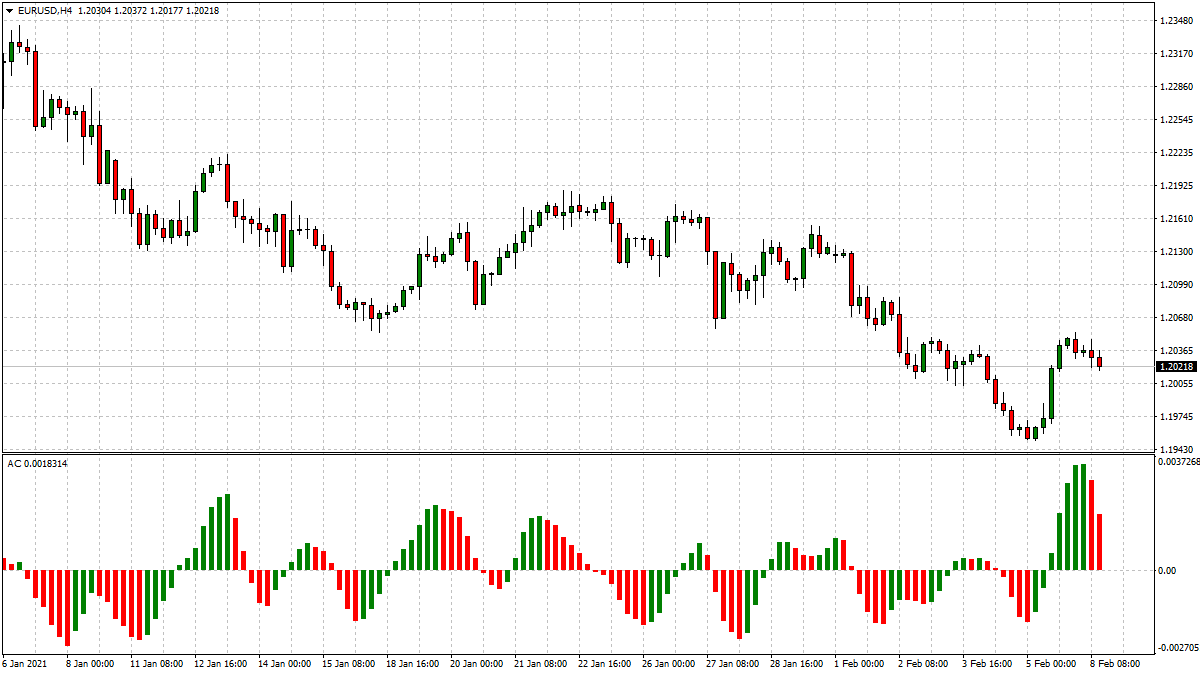
Der AC-Indikator ist ein Piktogramm, das von den grünen und roten Linien, die um Mittelniveau (null 0.00) schwanken und die Beschleunigung und Verzögerung von der aktuellen Antriebskraft messen, besteht. Der Indikator ändert seine Richtung, bevor der Preis seine Richtung ändert. Er dient als ein Frühwarnzeichen von wahrscheinlichen Richtungsänderungen vom Trend.
Die Farbenwechsel des Indikators sind sehr wichtig, weil die aktuelle grüne Linie (vom Preis unabhängig) vor Long-Positionen warnt, wie der rote gegen den Verkauf warnt.
Für die Eröffnung einer Position braucht man sowohl den Wert als auch die Farbe seiner treibenden Kraft zu beachten. Zwei grüne konsequente Linien über dem Nullniveau würden Sie andeuten, in den Markt mit einer Long-Position einzugehen, während mindestens zwei rote Linien unter dem Nullniveau als ein Verkaufssignal bewertet sein können.
Unechte Signale überwiegen auf den Charts mit den Zeitrahmen, die kleiner sind als 4 Stunden.

Acceleration/Deceleration (AC) Oscillator
Acceleration/Deceleration Oscillator Berechnungsformel
AC Linienchart ist der Unterschied zwischen dem Wert von 5/34 der treibenden Kraft des Liniencharts und dem bewegenden einfachen 5-Perioden-Durchschnitt.
AO = SMA (Mittelpreis, 5)-SMA (Mittelpreis, 34)AC = AO-SMA(AO, 5)
Wie setzt man Acceleration / Deceleration Oszillator auf der Handelsplattform ein
Forex Indicators FAQ
What is a Forex Indicator?
Forex technical analysis indicators are regularly used by traders to predict price movements in the Foreign Exchange market and thus increase the likelihood of making money in the Forex market. Forex indicators actually take into account the price and volume of a particular trading instrument for further market forecasting.
What are the Best Technical Indicators?
Technical analysis, which is often included in various trading strategies, cannot be considered separately from technical indicators. Some indicators are rarely used, while others are almost irreplaceable for many traders. We highlighted 5 the most popular technical analysis indicators: Moving average (MA), Exponential moving average (EMA), Stochastic oscillator, Bollinger bands, Moving average convergence divergence (MACD).
How to Use Technical Indicators?
Trading strategies usually require multiple technical analysis indicators to increase forecast accuracy. Lagging technical indicators show past trends, while leading indicators predict upcoming moves. When selecting trading indicators, also consider different types of charting tools, such as volume, momentum, volatility and trend indicators.
Do Indicators Work in Forex?
There are 2 types of indicators: lagging and leading. Lagging indicators base on past movements and market reversals, and are more effective when markets are trending strongly. Leading indicators try to predict the price moves and reversals in the future, they are used commonly in range trading, and since they produce many false signals, they are not suitable for trend trading.
Verwenden Sie Indikatoren nach dem Herunterladen von einer der Handelsplattformen, die von IFC Markets angeboten sind.
Große Auswahl an Handelsplattformen für alle Geräte

Not sure about your Forex skills level?
Take a Test and We Will Help You With The Rest


