- Education
- Forex Technical Analysis
- Technical Indicators
- Bill Williams Indicators
- Acceleration/Deceleration Oscillator
AC Indicator - Accelerator Oscillator
How to Use Accelerator Oscillator
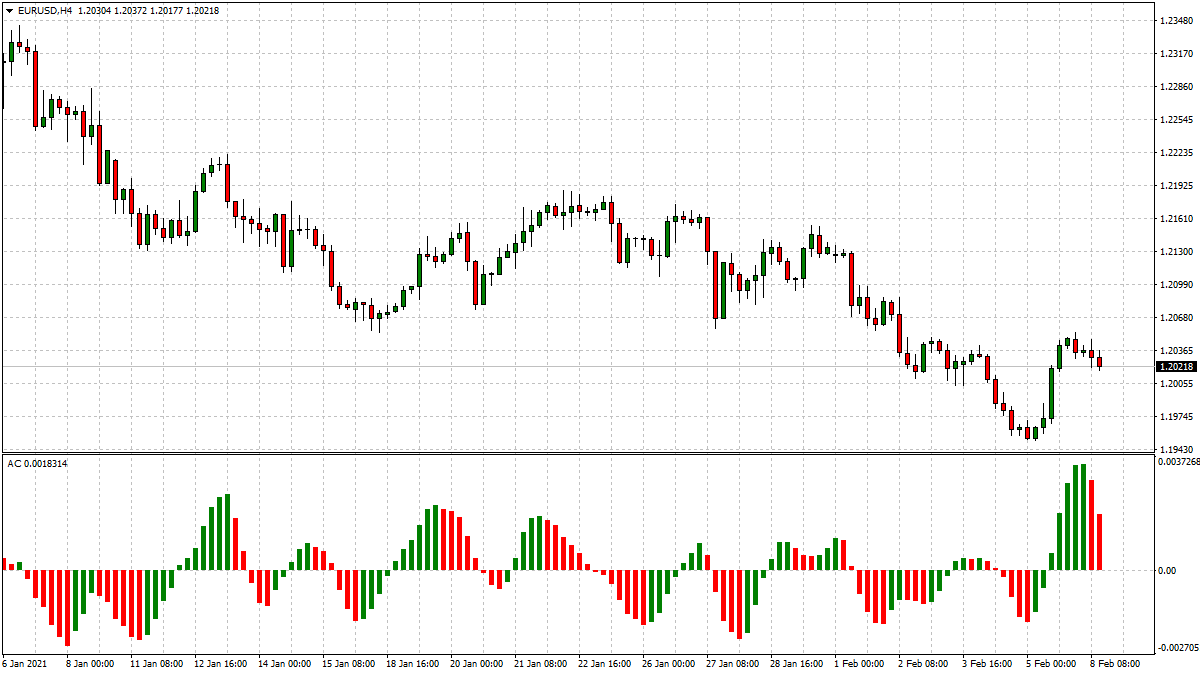
The Accelerator Oscillator is an indicator which fluctuates around a median 0.00 (zero) level which corresponds to a relative balance of the market driving force with the acceleration. Positive values signal a growing bullish trend, while negative values may be qualified as a bearish trend development. The AC indicator changes its direction before any actual trend reversals take place in the market therefore it serves as an early warning sign of probable trend direction changes.
To enter the market along with its driving force one needs to watch for both value and color.
- Two consecutive green columns above the zero level would suggest you to enter the market with a long position.
- At least two red columns below the zero level might be taken for a command to go short.
Fake signals prevail in timeframes smaller than 4 hours.

Accelerator Oscillator
Accelerator Oscillator Formula (Calculation)
In the Accelerator Oscillator formula the AC bar chart is the difference between the value of 5/34 of the driving force bar chart and 5-period simple moving average, taken from that bar chart.
AO = SMA(median price, 5)-SMA(median price, 34)AC = AO-SMA(AO, 5)
The Accelerator Oscillator indicator is calculated as a difference between the Awesome Oscillator (AO) and the 5-period moving average of the AO.
How to create Acceleration/Deceleration Oscillator in the trading platform
Forex Indicators FAQ
What is a Forex Indicator?
Forex technical analysis indicators are regularly used by traders to predict price movements in the Foreign Exchange market and thus increase the likelihood of making money in the Forex market. Forex indicators actually take into account the price and volume of a particular trading instrument for further market forecasting.
What are the Best Technical Indicators?
Technical analysis, which is often included in various trading strategies, cannot be considered separately from technical indicators. Some indicators are rarely used, while others are almost irreplaceable for many traders. We highlighted 5 the most popular technical analysis indicators: Moving average (MA), Exponential moving average (EMA), Stochastic oscillator, Bollinger bands, Moving average convergence divergence (MACD).
How to Use Technical Indicators?
Trading strategies usually require multiple technical analysis indicators to increase forecast accuracy. Lagging technical indicators show past trends, while leading indicators predict upcoming moves. When selecting trading indicators, also consider different types of charting tools, such as volume, momentum, volatility and trend indicators.
Do Indicators Work in Forex?
There are 2 types of indicators: lagging and leading. Lagging indicators base on past movements and market reversals, and are more effective when markets are trending strongly. Leading indicators try to predict the price moves and reversals in the future, they are used commonly in range trading, and since they produce many false signals, they are not suitable for trend trading.
Use indicators after downloading one of the trading platforms, offered by IFC Markets.

Not sure about your Forex skills level?
Take a Test and We Will Help You With The Rest


