- Analytics
- Technical Analysis
Brent Crude Oil Technical Analysis - Brent Crude Oil Trading: 2018-06-19
Higher expected crude output bearish for Brent
OPEC and Russia are expected to raise output to offset Venezuela and Iran supply shortfalls. Will Brent prices continue the decline?
Major crude oil producers will meet Friday to discuss crude oil production quotas. Saudi Arabia, the major oil producer of the Organization of the Petroleum Exporting Countries, is considering an output boost of 500,000 to 1 million barrels a day, according to media reports. Russia, another top world producer of crude oil, is considering expanding its output by as much as 1.5 million barrels. Higher expected output forecast is bearish for Brent.
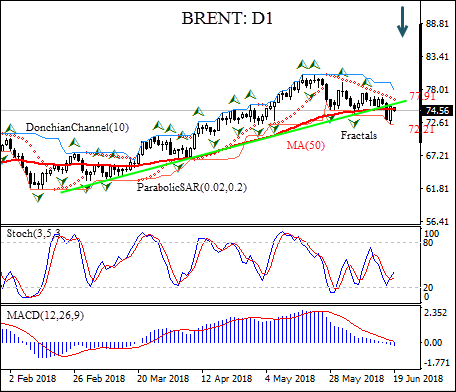
On the daily timeframe the BRENT: D1 has been trading with negative bias after hitting thirty-one-month high in mid-May. The price has breached below the support line. It had breached below the 50-day moving average MA(50) which is leveling off.
- The Donchian channel signals downtrend: it is tilted lower.
- The Parabolic indicator has formed a sell signal.
- The MACD indicator is below the signal line and the gap is widening, which is bearish.
- The stochastic oscillator is rising and hasn’t reached the overbought zone yet.
We believe the bearish momentum will continue after the price closes below the lower boundary of Donchian channel at 72.21. This level can be used as an entry point for placing a pending order to sell. The stop loss can be placed above last fractal high at 77.91. After placing the order, the stop loss is to be moved every day to the next fractal high, following Parabolic signals. Thus, we are changing the probable profit/loss ratio to the breakeven point. If the price meets the stop loss level (77.91) without reaching the order (72.21), we recommend cancelling the order: the market has undergone internal changes which were not taken into account.
Technical Analysis Summary
| Position | Sell |
| Sell stop | Below 72.21 |
| Stop loss | Above 77.91 |
Explore our
Trading Conditions
- Spreads from 0.0 pip
- 30,000+ Trading Instruments
- Stop Out Level - Only 10%
Ready to Trade?
Open Account Note:
This overview has an informative and tutorial character and is published for free. All the data, included in the overview, are received from public sources, recognized as more or less reliable. Moreover, there is no guarantee that the indicated information is full and precise. Overviews are not updated. The whole information in each overview, including opinion, indicators, charts and anything else, is provided only for familiarization purposes and is not financial advice or а recommendation. The whole text and its any part, as well as the charts cannot be considered as an offer to make a deal with any asset. IFC Markets and its employees under any circumstances are not liable for any action taken by someone else during or after reading the overview.
