- Analytics
- Technical Analysis
EUR USD Technical Analysis - EUR USD Trading: 2019-10-31
Lower euro-zone inflation bearish for EURUSD
Eurostat reported euro-zone headline inflation is expected to be 0.7% in October 2019, down from 0.8% in September. Will the EURUSD decline?
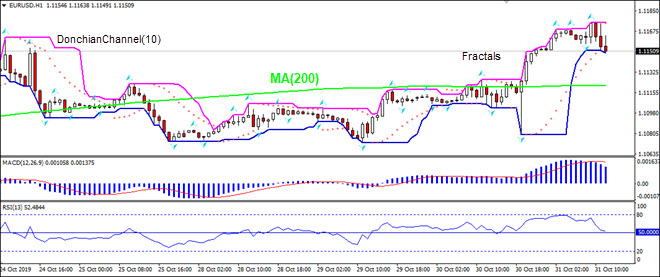
The price chart on 1-hour timeframe shows EURUSD: H1 is trading sideways. The price is falling toward the 200-period moving average MA(200) which is level. And the RSI oscillator is above 50 level but has not reached the overbought zone. There is no trend yet formed, traders have to decide when it would be a best time to enter the market.
Explore our
Trading Conditions
- Spreads from 0.0 pip
- 30,000+ Trading Instruments
- Stop Out Level - Only 10%
Ready to Trade?
Open Account Note:
This overview has an informative and tutorial character and is published for free. All the data, included in the overview, are received from public sources, recognized as more or less reliable. Moreover, there is no guarantee that the indicated information is full and precise. Overviews are not updated. The whole information in each overview, including opinion, indicators, charts and anything else, is provided only for familiarization purposes and is not financial advice or а recommendation. The whole text and its any part, as well as the charts cannot be considered as an offer to make a deal with any asset. IFC Markets and its employees under any circumstances are not liable for any action taken by someone else during or after reading the overview.
