- Analytics
- Technical Analysis
GBP USD Technical Analysis - GBP USD Trading: 2015-08-12
Probable triangle escape
Let us consider the GBP/USD currency pair chart. We observe the Chinese yuan being devaluated this week, which makes a Fed rate hike in September less likely. This weakens the American dollar against most major currencies including the British pound. We believe that the main factor which may affect price dynamics is the estimated rate hike by Bank of England, the first one since 2008. Market participants have recently been discussing this isue with enthusiasm. Last week Bank of England left the current 0.5% interest rate unchanged. Only one Monetary Policy Commitee member voted in favour of immediate rate increase. Now as many as 2 members support this measure, this sentiment underpins the British pound. Labor market data, released on Wednesday, produced additional support to the currency: they generally met forecasts. Unemployment remains low, while wages grow faster. At the same time in June Great Britain recorded the 0% inflation.
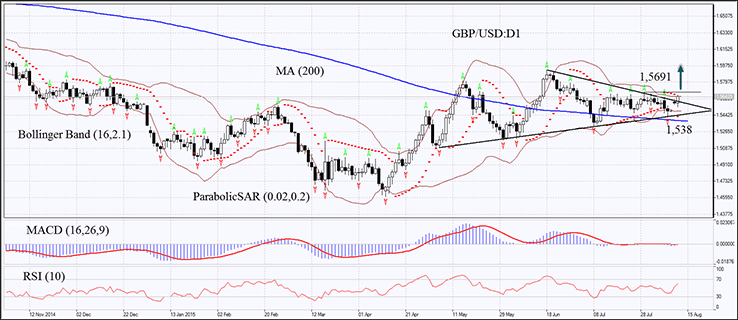
On the daily time frame the GBP/USD chart tends to increase, trying to cross up the triangle. The pair has been traded above the 200-day Moving Average. Parabolic has shaped a buy signal. MACD bars are too small, so this indicator does not show any signals. RSI-Bars breached 50 but has not yet reached the overbought zone. Bollinger bands remarkably narrowed, indicating low volatility. A bullish trend may develop if the GBP/USD daily bar closes above the Bollinger upper line, the Parabolic signal and second fractal at 1.5691. A stop loss may be placed below the 200-day Moving Average at 1.538. After pending order activation the stop loss is supposed to be moved every day to the next fractal low, following Parabolic and Bollinger signals. Thus, we are changing the probable profit/loss ratio to the breakeven point. The most cautious traders are recommended to switch to the H4 time frame and place a stop loss there, moving it after the trend. If the price reaches the stop loss without triggering the order, we recommend to cancel the position: the market sustains internal changes that were not considered.
| Position | Buy |
| Buy stop | above 1.5691 |
| Stop loss | below 1.538 |
Explore our
Trading Conditions
- Spreads from 0.0 pip
- 30,000+ Trading Instruments
- Stop Out Level - Only 10%
Ready to Trade?
Open Account Note:
This overview has an informative and tutorial character and is published for free. All the data, included in the overview, are received from public sources, recognized as more or less reliable. Moreover, there is no guarantee that the indicated information is full and precise. Overviews are not updated. The whole information in each overview, including opinion, indicators, charts and anything else, is provided only for familiarization purposes and is not financial advice or а recommendation. The whole text and its any part, as well as the charts cannot be considered as an offer to make a deal with any asset. IFC Markets and its employees under any circumstances are not liable for any action taken by someone else during or after reading the overview.
