- Analytics
- Technical Analysis
Ruble vs Yen Technical Analysis - Ruble vs Yen Trading: 2017-08-23
On Friday, inflation data will come out in Japan
In this review, we suggest considering the personal composite instrument (PCI) "Ruble vs. Yen". It reflects the price dynamics of the Russian ruble against the Japanese yen. The PCI grows in case of the strengthening of the ruble and the weakening of the yen. Is there a possibility for the RUBJPY to grow?
The Russian ruble remains stable or is strengthening, while the price of Brent oil exceeds $50 per barrel. The strengthening of the yen has a negative impact on the performance of the Japanese exporting companies, so the Bank of Japan tries to struggle against it. In particular, it can refuse to tighten the monetary policy or raise rates, despite the inflation growth. This can weaken the yen exchange rate. On Friday, August 25, the consumer price index for July will be released in Japan. It is expected to grow for the 7th month in a row. The key indicator of the Consumer Price Index Ex-Fresh Food may be 0.5%. This is still much lower than the Bank of Japan target level of 2%. According to the survey of the Japanese companies by the Nikkei Research agency, only 14% of the respondents support the further easing of the Bank of Japan monetary policy. They believe that such measures do not cope well with deflation and contribute to risky debts growth.
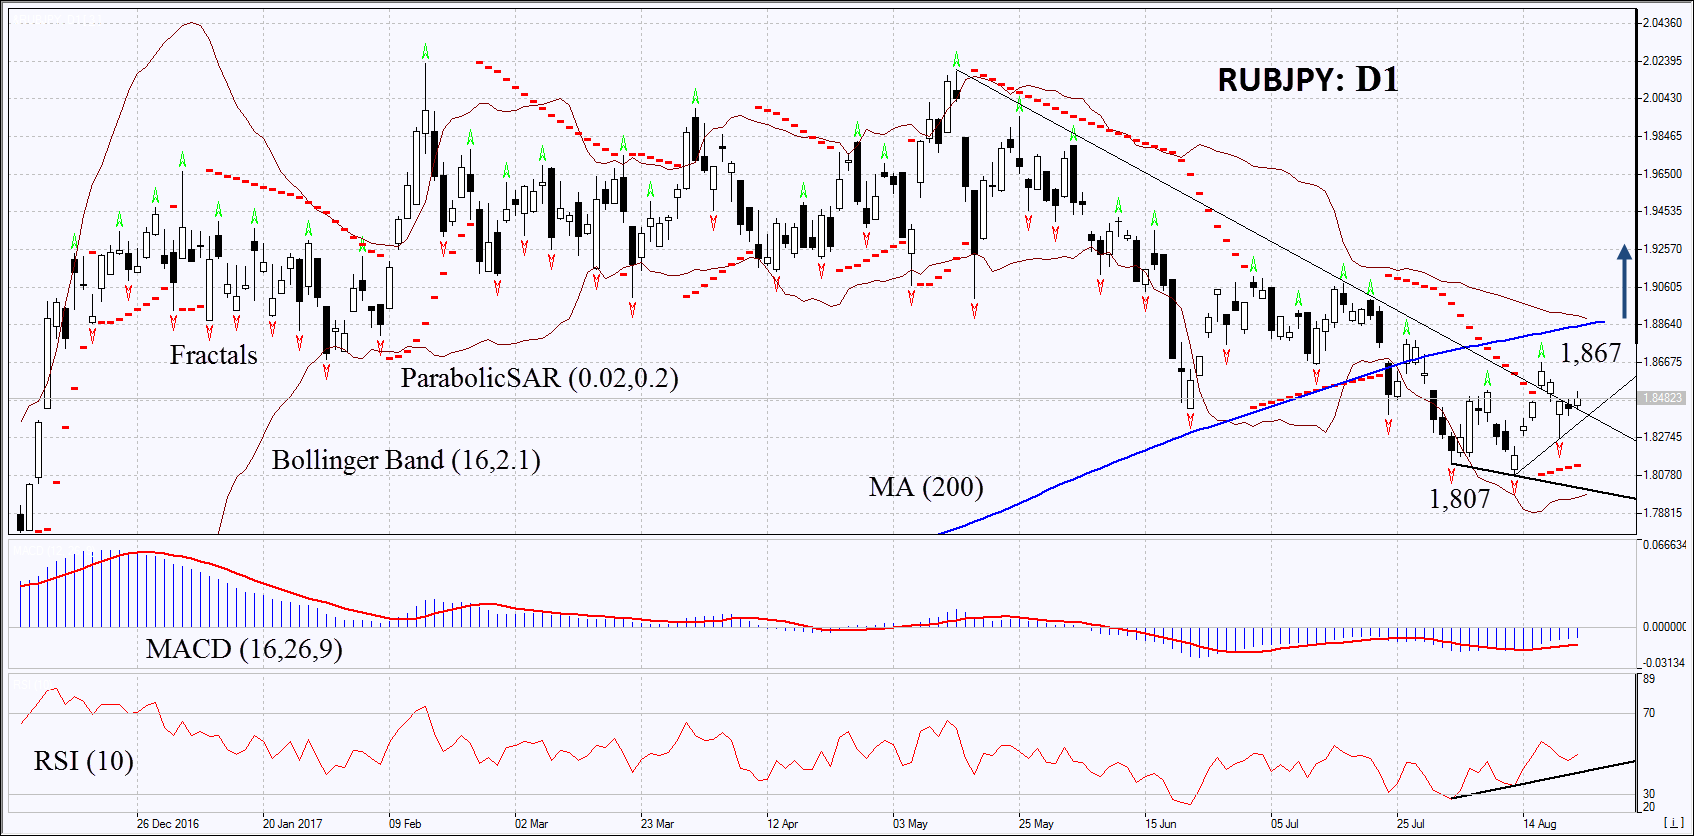
On the daily timeframe, RUBJPY: D1 came out from the downtrend. The further price increase is possible in case the Brent oil price remains above $50 per barrel and the Bank of Japan continues the policy of low rates and the yen emission.
- The Parabolic indicator gives a bullish signal.
- The Bollinger bands widened, which means higher volatility. They are tilted upwards.
- The RSI indicator is above 50. It has formed a positive divergence.
- The MACD indicator still gives a bullish signal.
The bullish momentum may develop in case RUBJPY exceeds the last fractal high at 1.867. This level may serve as an entry point. The initial stop loss may be placed below the last fractal low, the 9-month low and the Parabolic signal at 1.807. After opening the pending order, we shall move the stop to the next fractal low following the Bollinger and Parabolic signals. Thus, we are changing the potential profit/loss to the breakeven point. More risk-averse traders may switch to the 4-hour chart after the trade and place there a stop loss moving it in the direction of the trade. If the price meets the stop level at 1.807 without reaching the order at 1.867 we recommend cancelling the position: the market sustains internal changes that were not taken into account.
Summary of technical analysis
| Position | Buy |
| Buy stop | above 1,867 |
| Stop loss | below 1,807 |
Explore our
Trading Conditions
- Spreads from 0.0 pip
- 30,000+ Trading Instruments
- Stop Out Level - Only 10%
Ready to Trade?
Open Account Note:
This overview has an informative and tutorial character and is published for free. All the data, included in the overview, are received from public sources, recognized as more or less reliable. Moreover, there is no guarantee that the indicated information is full and precise. Overviews are not updated. The whole information in each overview, including opinion, indicators, charts and anything else, is provided only for familiarization purposes and is not financial advice or а recommendation. The whole text and its any part, as well as the charts cannot be considered as an offer to make a deal with any asset. IFC Markets and its employees under any circumstances are not liable for any action taken by someone else during or after reading the overview.
