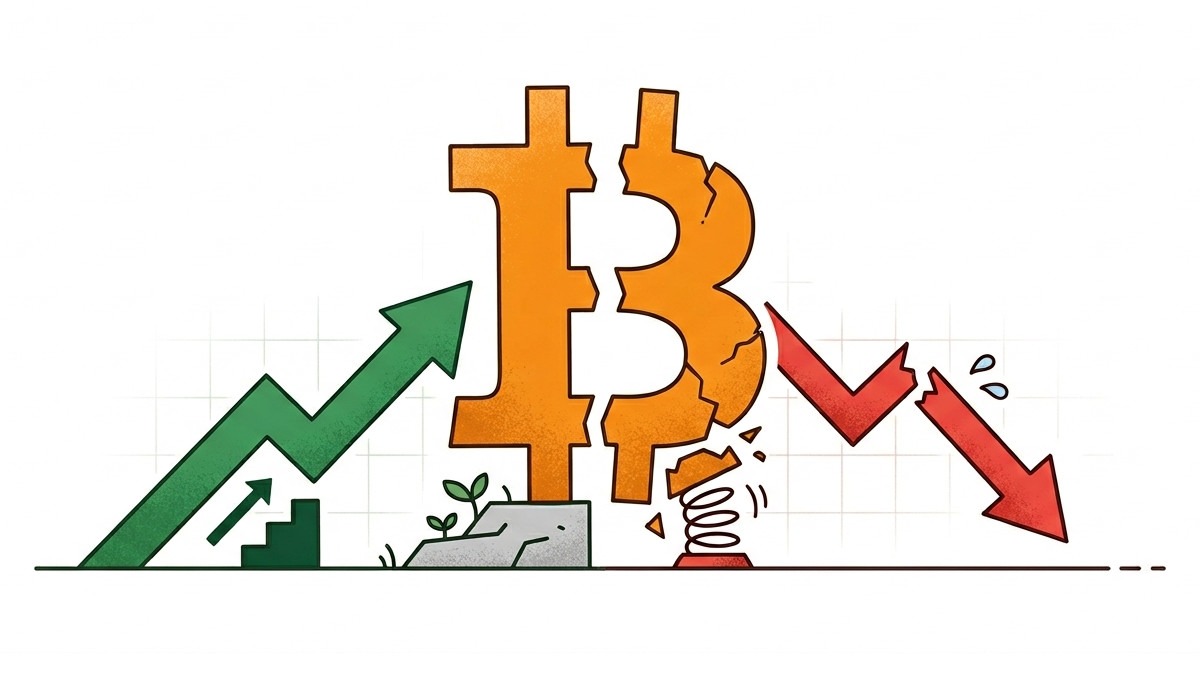
- Analyses
- Actualités du trading
- S&P 500 et Nasdaq : Fort recul
S&P 500 et Nasdaq : Fort recul

Le S&P 500 et le Nasdaq viennent de subir un net repli après des mois de fortes hausses. De début avril jusqu'au pic de la semaine dernière, les deux indices ont progressé : le S&P 500 a progressé de plus de 25 % et le Nasdaq de près de 40 %. Mais la semaine dernière, la situation a basculé.
Ce qui a déclenché le recul
Plusieurs drapeaux rouges ont été signalés simultanément:
- Les données sur l'inflation et l'emploi ont déçu jeudi et vendredi.
- La Fed maintient ses taux inchangés, mais n'a aucune indication concrète de baisses futures.
- Nouveaux tarifs douaniers et montagnes russes de la politique commerciale
- La faiblesse saisonnière du mois d’août est historiquement un frein pour les actions.
Le S&P 500 a perdu près de 3 % en quelques jours, clôturant autour de 6 238 points. Le Nasdaq a chuté encore plus brutalement, perdant près de 4 % à environ 20 763 points.
Pourquoi le mois d'août est important
Historiquement, août est l'un des mois les plus faibles pour les actions. Cette tendance pèse lourdement sur les investisseurs. Le S&P 500 vient de passer sous sa moyenne mobile à 20 jours, une ligne de tendance à court terme que de nombreux traders observent. Lorsque les prix tombent en dessous de ce niveau, cela indique souvent que l'élan ralentit. L'indice pourrait chuter davantage jusqu'à 6 100, soit environ 5 % en dessous des sommets récents, avant de retrouver un support.
Qu'est-ce qui ne va pas d'autre?
- Les services publics (considérés comme des secteurs à faible risque et à dividendes réguliers), souvent un secteur sûr, sont en hausse, ce qui indique généralement une peur ou un positionnement défensif.
- Les actions du secteur des logiciels pourraient rebondir, elles ont été à la traîne par rapport aux fabricants de puces et ont historiquement fait mieux en août.
- Des baisses de taux de la Fed sont désormais attendues, mais non garanties. Les marchés à terme anticipent désormais une baisse d'environ 60 points de base d'ici décembre, contre 33 en début de semaine dernière.
De plus, Trump a limogé le directeur du Bureau des statistiques du travail, ce qui suscite des doutes quant à la crédibilité des données sur l’emploi futur. Et si les tribunaux décident que les tarifs douaniers de Trump sont illégaux, les États-Unis pourraient être obligés de les annuler, de restituer des milliards aux entreprises qui les ont payés et de risquer de compromettre les accords commerciaux.
À court terme la volatilité devrait augmenter, une chute rapide à 6 100 est possible, mais cela peut être une opportunité d'achat. Attendez-vous à davantage de turbulences en septembre, avec un possible apaisement en octobre.
À long terme, si l'inflation reste stable (les prix continuent d'augmenter plus vite que prévu et ne baissent pas facilement, même après une hausse des taux d'intérêt) et que l'emploi se dégrade, la Fed pourrait être contrainte de baisser ses taux, ce qui favoriserait la reprise des actions d'ici fin 2025. Le ratio cours/bénéfice prévisionnel de 22,4 est relativement élevé par rapport aux normes historiques : les investisseurs paient 22,40 $ pour chaque dollar de bénéfices futurs attendus des sociétés du S&P 500. Et si les bénéfices ne croissent pas assez vite pour justifier ces prix élevés, alors il n'y a pas beaucoup de marge pour que les actions continuent à augmenter, elles sont déjà valorisées pour des résultats solides.
Que devraient faire les traders?
- Observer le niveau de support 6 100.
- Ne précipiter pas pour acheter à chaque baisse, les marchés sont encore instables et d'autres hauts et bas sont probables.
- Privilégier les secteurs défensifs, à court terme.
- Les actions des logiciels pourraient rebondir au cours du mois prochain.
- Rester prudent jusqu'en septembre, mais préparez-vous à être long si octobre apporte de la clarté.
Nouvel outil puissant, Technicals S&P 500
Nouvel outil puissant, Technicals S&P 500
Analyse technique en direct avec prévisions instantanées utilisant les indicateurs et oscillateurs les plus populaires
Essayer maintenant
Si vous ne trouvez pas un moyen de gagner de l’argent pendant votre sommeil, vous allez travailler jusqu’à votre mort.- Warren Buffett