- Analytics
- Technical Analysis
AUD USD Technical Analysis - AUD USD Trading: 2017-08-03
The Reserve Bank of Australia is concerned about the strengthening of the national currency
The Reserve Bank of Australia is concerned about the strengthening of the national currency On Tuesday, the Reserve Bank of Australia (RBA) held its regular meeting. As expected, it kept the interest rate unchanged, but noted the negative economic effect of a too strong national currency. Will the Australian dollar quotes decrease?
The RBA rate is currently at its historic low of 1.5%. At the same time, the Australian inflation for Q2, 2017 is 1.9% in annual terms. It is already close to the RBA target level of 2-3%. Along with a relatively modest GDP growth of 1.7% in Q1, this limits the RBA capability to hike rates. It can be noted that currently the Australian economic growth is at the lowest level since Q3, 2009. On the background of the weak US dollar, this did not prevent the Australian dollar from strengthening by 9% just in the last two months. Theoretically, the RBA economic comment may contribute to a downward correction. On Thursday, the June trade balance, and on Friday the RBA statement on monetary policy will be released in Australia. They can boost the movement of the Australian dollar exchange rate.
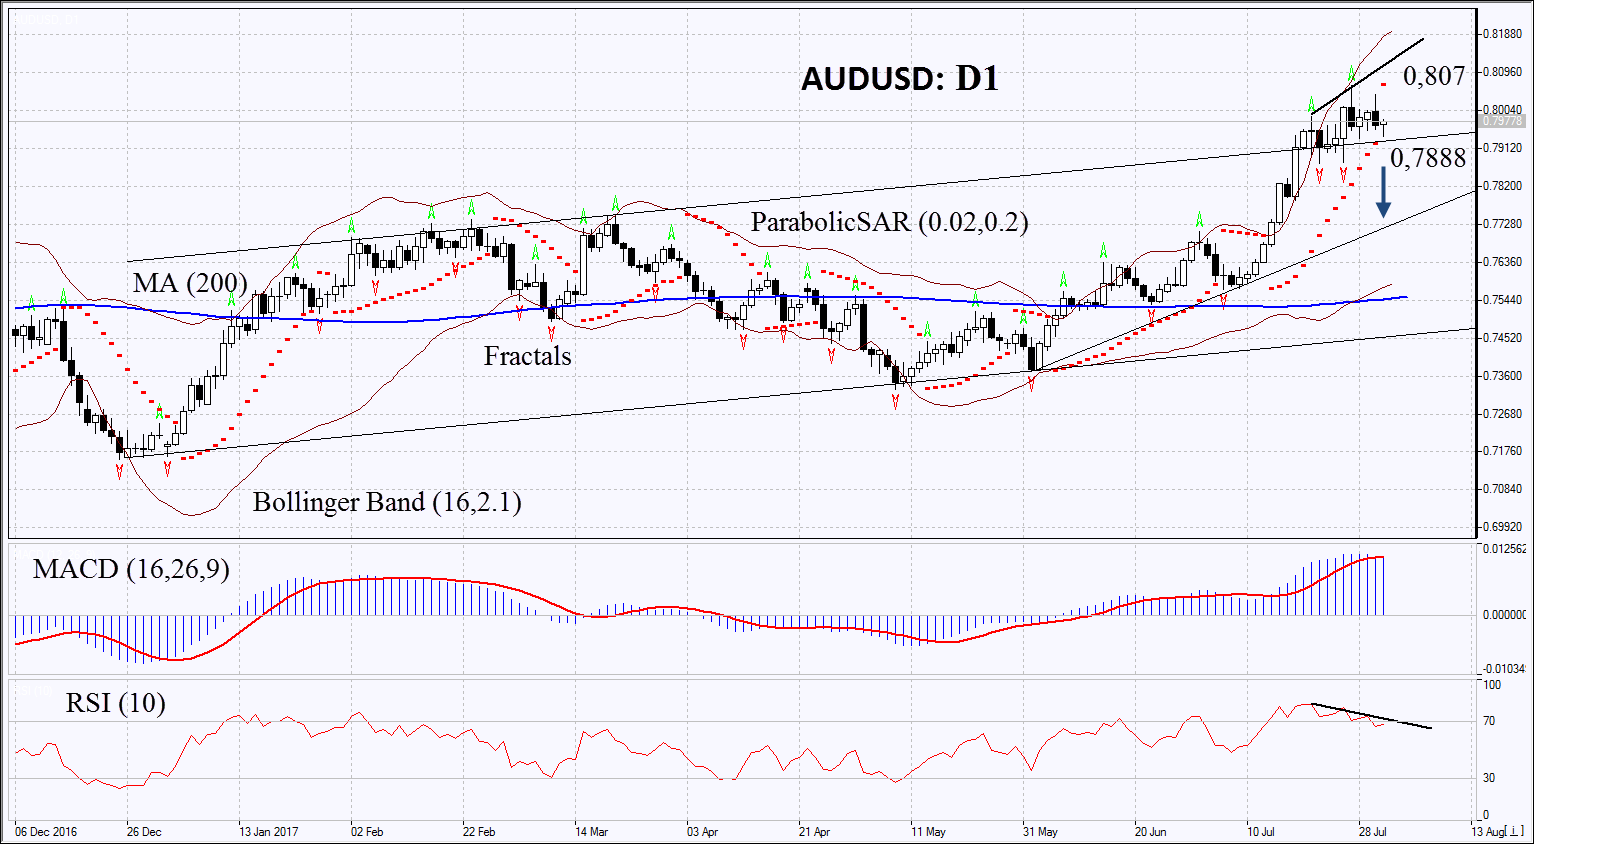
On the daily timeframe, AUDUSD: D1 remains in the rising trend. However, its growth has slowed down and a number of indicators have formed bearish signals. The downward correction is possible in case of the publication of weak economic data in Australia and the growth of the US dollar index.
- The Parabolic indicator gives a bearish signal.
- The Bollinger bands have markedly widened, which means higher volatility.
- The RSI indicator is above 50. It has formed a negative divergence.
- The MACD indicator gives a bearish signal.
The bearish momentum may develop in case AUDUSD drops below the last fractal low at 0.7888. This level may serve as an entry point. The initial stop loss may be placed above the last fractal high, the 26-month high and the Parabolic signal at 0.807. After opening the pending order, we shall move the stop to the next fractal high following the Bollinger and Parabolic signals. Thus, we are changing the potential profit/loss to the breakeven point. More risk-averse traders may switch to the 4-hour chart after the trade and place there a stop loss moving it in the direction of the trade. If the price meets the stop level at 0.807 without reaching the order at 0.7888 we recommend cancelling the position: the market sustains internal changes that were not taken into account.
Summary of technical analysis
| Position | Sell |
| Sell stop | below 0,7888 |
| Stop loss | above 0,807 |
Explore our
Trading Conditions
- Spreads from 0.0 pip
- 30,000+ Trading Instruments
- Stop Out Level - Only 10%
Ready to Trade?
Open Account Note:
This overview has an informative and tutorial character and is published for free. All the data, included in the overview, are received from public sources, recognized as more or less reliable. Moreover, there is no guarantee that the indicated information is full and precise. Overviews are not updated. The whole information in each overview, including opinion, indicators, charts and anything else, is provided only for familiarization purposes and is not financial advice or а recommendation. The whole text and its any part, as well as the charts cannot be considered as an offer to make a deal with any asset. IFC Markets and its employees under any circumstances are not liable for any action taken by someone else during or after reading the overview.
