- Analytics
- Technical Analysis
Cocoa Technical Analysis - Cocoa Trading: 2016-12-20
Weak weather lifts prices up
Cocoa shipments to sea harbors of Cote-d’Ivoire fell 3.4% to 647 thousand tonnes since October 1 to December 18, 2016 compared to the same period of 2017. Will cocoa prices advance?
Agricultural season 2016/17 in Cote-d’Ivoire started on October 1, 2016. The country is the global leader in cocoa production and accounts for 35% of global market. Cocoa prices started advancing last week after the forecast came out that West-African Passat Harmattan is beginning to form. Harmattan is a dry wind which blows from the Sahara desert between the end of November and the middle of March. Harmattan may harm cocoa trees. Cocoa beans prices hugely depend on weather forecasts in Western Africa and the region accounts for 75% of global cocoa crops. Another factor which supports cocoa prices is that cocoa exports from Indonesia may fall 30% to 27-28 thousand tonnes this year compared to 2015, according to Indonesian Cocoa Association. Shipments abroad fell as cocoa crops in the country declined from 377 thousand tonnes to 350 thousand tonnes. Indonesia accounts for around 10.5% in global cocoa production. Large net short position is opened in cocoa futures and options. Theoretically, if they are speculatively closed, it may push cocoa prices up.
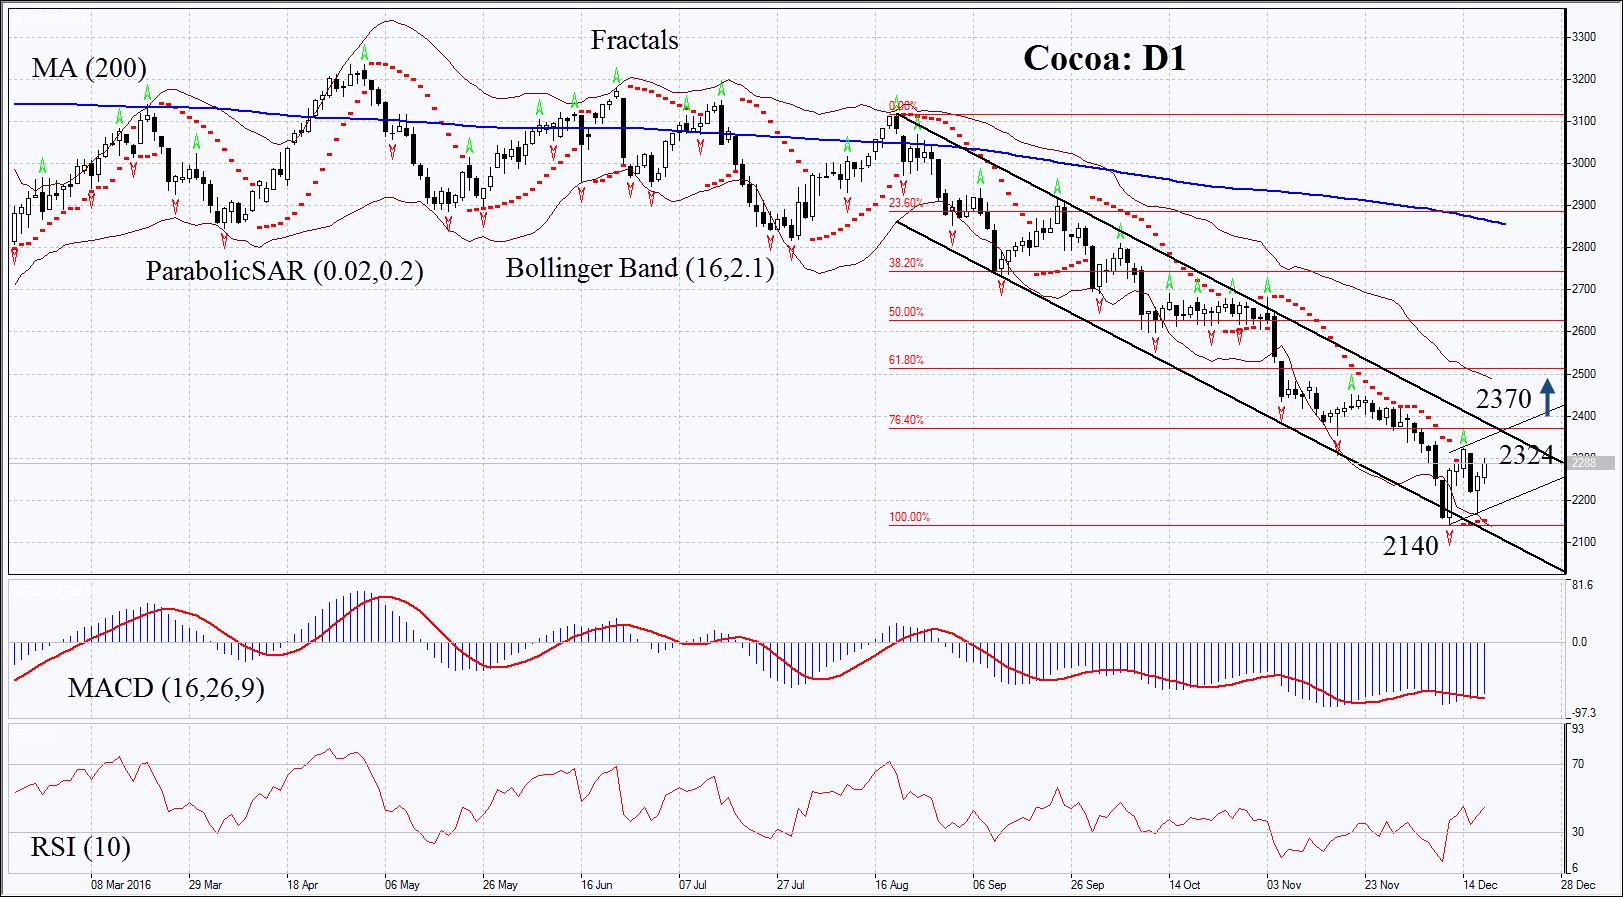
On the daily chart Cocoa: D1 is in downtrend. Its prices have reached the low since April 2013 and slightly corrected upwards. Further increase is possible in case of worse weather forecasts in Western Africa.
- Parabolic indicator gives bullish signal.
- Bollinger bands have widened which means higher volatility.
- RSI is below 50, no divergence.
- MACD gives bullish signal.
The bullish momentum may develop in case cocoa surpasses the last fractal high at 2324. This level may serve the point of entry. The most risk-averse traders may wait for surpassing the 1st Fibonacci level and upper boundaries of two trends at 2370. The initial stop-loss may be placed below the Parabolic signal, the last fractal low and the multi-year low at 2140. Having opened the pending order we shall move the stop to the next fractal low following the Parabolic and Bollinger signals. Thus, we are changing the probable profit/loss ratio to the breakeven point. The most risk-averse traders may switch to the 4-hour chart after the trade and place there a stop-loss moving it in the direction of the trade. If the price meets the stop-loss level at 2140 without reaching the order at 2324 or 2370, we recommend cancelling the position: the market sustains internal changes which were not taken into account.
Summary of technical analysis
| Position | Buy |
| Buy stop | above 2324 or 2370 |
| Stop loss | below 2140 |
Explore our
Trading Conditions
- Spreads from 0.0 pip
- 30,000+ Trading Instruments
- Instant Execution
Ready to Trade?
Open Account Note:
This overview has an informative and tutorial character and is published for free. All the data, included in the overview, are received from public sources, recognized as more or less reliable. Moreover, there is no guarantee that the indicated information is full and precise. Overviews are not updated. The whole information in each overview, including opinion, indicators, charts and anything else, is provided only for familiarization purposes and is not financial advice or а recommendation. The whole text and its any part, as well as the charts cannot be considered as an offer to make a deal with any asset. IFC Markets and its employees under any circumstances are not liable for any action taken by someone else during or after reading the overview.
