- Analytics
- Technical Analysis
Cocoa Technical Analysis - Cocoa Trading: 2017-05-01
Cote d’Ivoire reduced the export of raw cocoa beans
The cocoa prices declined by 44% over the last 12 months. Meanwhile, Cote d’Ivoire, the world’s largest cocoa producer, decreased the export of raw beans in 2016/17 season by 2.3% compared to the same period of the previous season. Will the cocoa prices rise?
The 2016/17 agricultural season started from October 1, 2016. From that time till the end of March of the current year, the export from Cote d’Ivoire amounted to 892.7 thousand tonnes compared to 914 thousand tonnes for the same period of the previous season. Deliveries of cocoa semi-finished products on the world market from the Cote d’Ivoire have slightly increased by 2.5% and amounted to 219.3 thousand tonnes since the beginning of 2016/17 season. Meanwhile, market participants expected a considerable growth in the world cocoa production. Recently, its prices have slumped to the lowest in 9 and a half years. According to the U.S. Commodities Futures Trading Commission, the net short position on cocoa reached the highest in 11 years, which may indicate a significant activity of speculators. Cote d’Ivoire accounts for 36% of the world production of this agricultural product. Theoretically, a weak growth of exports from this country may cause an upward correction of cocoa prices. Note, that the US Hershey company reported an increase in the quarterly revenue from the sales of chocolate products by 2.8% to $1.88 bn. It may be assumed that this indicates about a stable high demand not only in the US, but also in other developed countries.
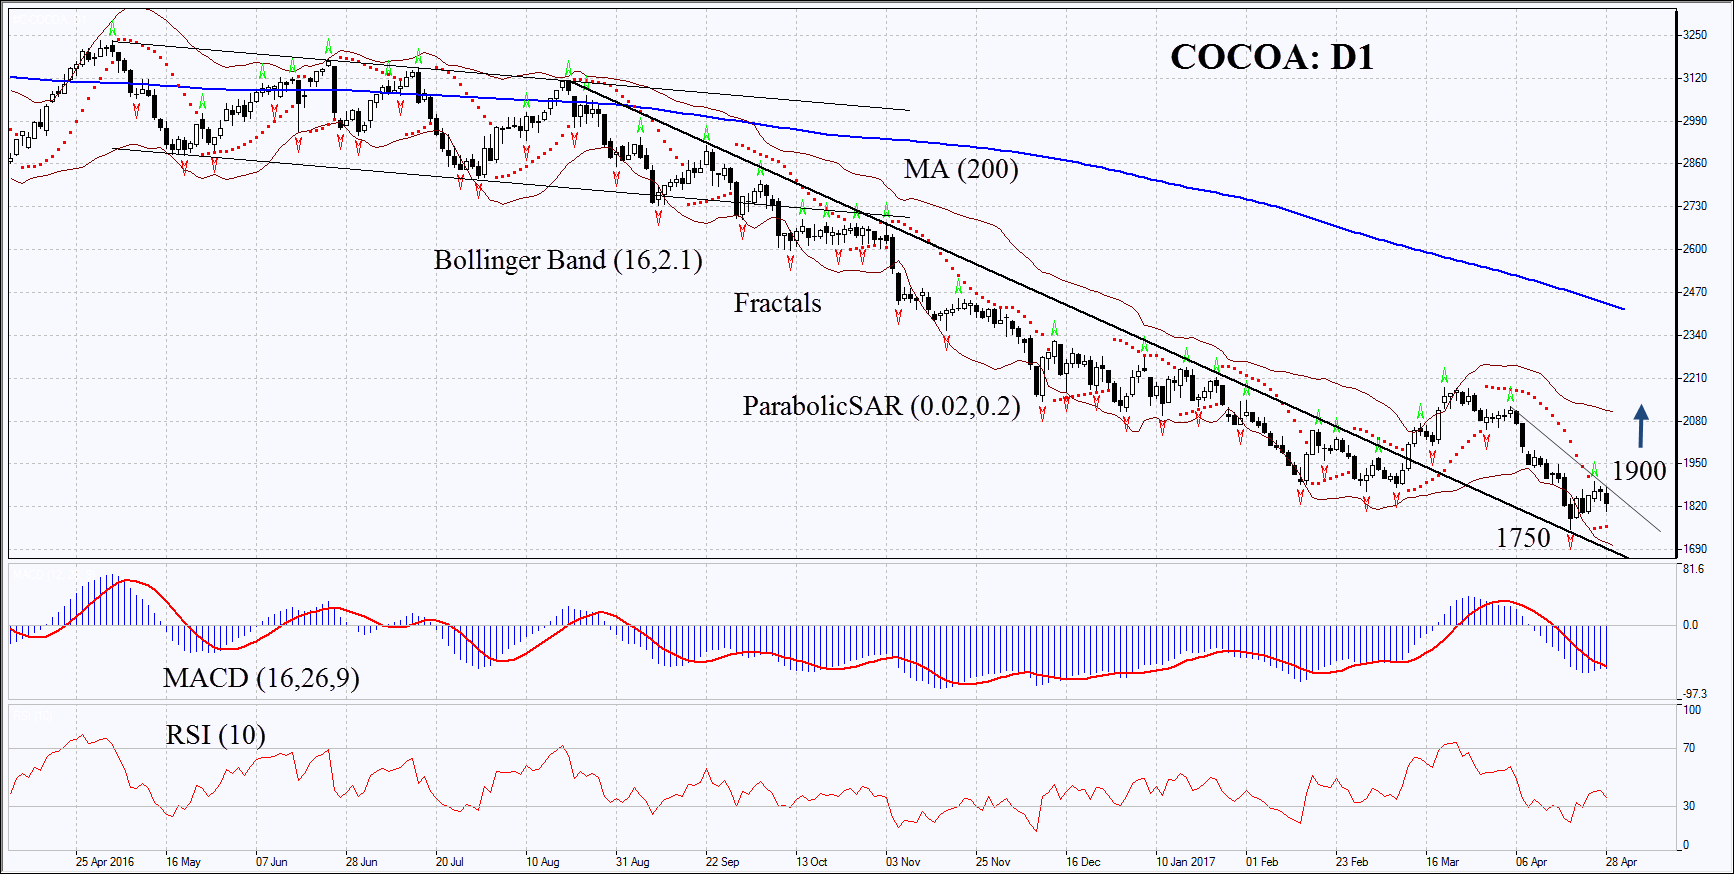
On the daily time frame, Cocoa: D1 is in a downtrend, but, at the same time, it is trying to correct upwards. The price growth is possible in case of decline in world harvest with a stable high demand for chocolate.
- The Parabolic indicator gives a bullish signal.
- The Bollinger bands have widened which means higher volatility.
- The RSI indicator is below 50. No divergence.
- The MACD indicator gives bullish signals.
The bullish momentum may develop in case Cocoa exceeds the last fractal high at 1900. This level may serve as a entry point. The initial stop-loss may be placed below the Parabolic signal and the last fractal low at 1750. After opening the pending order, we shall move the stop to the next fractal low following the Bollinger and Parabolic signals. Thus, we are changing the potential profit/loss to the breakeven point. More risk-averse traders may switch to the 4-hour chart after the trade and place there a stop-loss moving it in the direction of the trade. If the price meets the stop level at 1750 without reaching the order at 1900 we recommend cancelling the position: the market sustains internal changes that were not taken into account.
Technical Analysis Summary
| Position | Buy |
| Buy stop | 1900 |
| Stop loss | 1750 |
- Get Certificate

Note:
This overview has an informative and tutorial character and is published for free. All the data, included in the overview, are received from public sources, recognized as more or less reliable. Moreover, there is no guarantee that the indicated information is full and precise. Overviews are not updated. The whole information in each overview, including opinion, indicators, charts and anything else, is provided only for familiarization purposes and is not financial advice or а recommendation. The whole text and its any part, as well as the charts cannot be considered as an offer to make a deal with any asset. IFC Markets and its employees under any circumstances are not liable for any action taken by someone else during or after reading the overview.
