- Analytics
- Technical Analysis
Arabica Coffee Technical Analysis - Arabica Coffee Trading: 2016-12-19
Bad weather may harm crops in Vietnam
Rainstorms may harm coffee crops in Vietnam and the quality of cocoa beans. Coffee exports fell 2.3% in November 2016 compared to October to 114.7 thousand tonnes. This is below the official forecast of 120 thousand tonnes from the Vietnamese agency General Statistics Office. Will coffee prices advance?
Vietnam produces around 20% of global coffee production and cultivates robusta. Early in December Vietnamese producers forecasted with optimism that coffee exports will amount to 150 thousand tonnes in December. This is below the last year’s level of 152 thousand tonnes. Vietnam Coffee and Cocoa Association expects coffee production to fall 10-20% in 2016/17 agricultural season. As a result, Vietnamese farmers may decide to sell lower volume of newly harvested beans in January 2017. Coffee prices may also advance on the news from Green Coffee Association that green coffee stockpiles edged lower in US. A couple of days ago Brazilian government approved of robusta imports from Vietnam for the first time in a decade. It is needed for coffee refining plants. Crops may fall in Brazil this year due to drought. Brazil is global leader in coffee production accounting for 34% of the market. It mainly cultivates arabica. Robusta crops are forecasted to be 8.35mln of 60-kg bags in Brazil this year which is below the record level of 13mln bags 2 years ago.
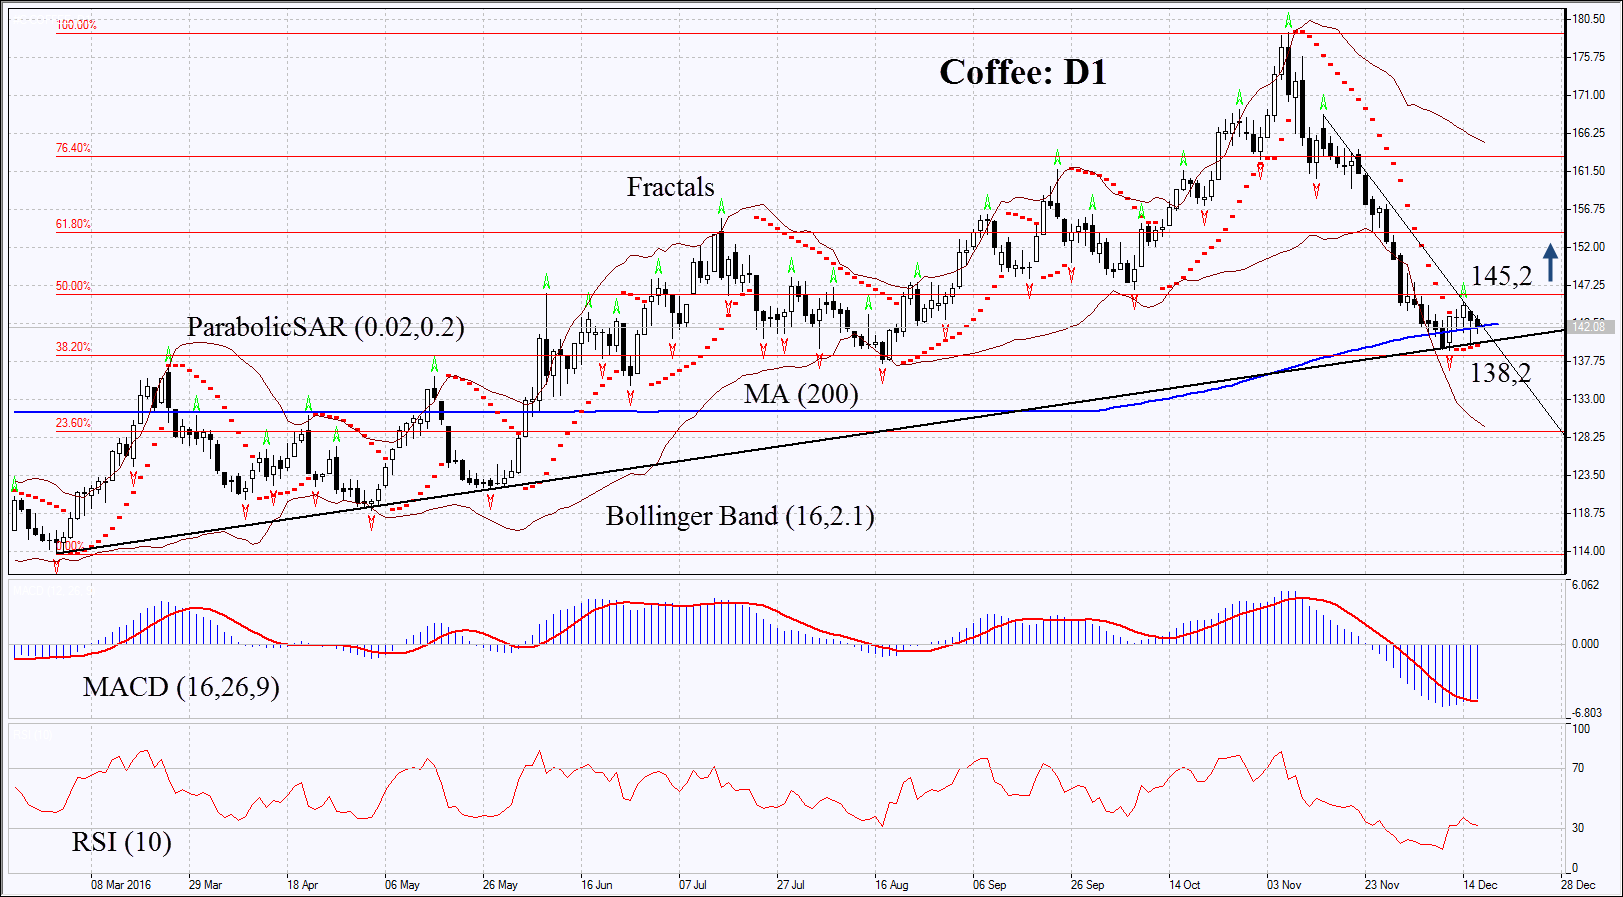
On the daily chart Coffee: D1 is in the descending trend. It has reached the trend-line support, 200-day MA and Fibonacci retracement at 38.2%. Now the chart is struggling for correcting upwards. Further price increase is possible in case of worse weather and global crops.
- Parabolic indicator gives bullish signals.
- Bollinger bands have widened which signifies higher volatility.
- RSI is below 50. It has left the oversold zone, no divergence.
- MACD gives bullish signals.
The bullish momentum may develop in case coffee surpasses the last fractal high at 145.2. This level may serve the point of entry. The initial stop-loss may be placed below the last fractal low, the Parabolic signal, the trend line and the Fibonacci level at 138.2. Having opened the pending order we shall move the stop to the next fractal low following the Parabolic and Bollinger signals. Thus, we are changing the probable profit/loss ratio to the breakeven point. The most risk-averse traders may switch to the 4-hour chart after the trade and place there a stop-loss moving it in the direction of the trade. If the price meets the stop-loss level at 138.2 without reaching the order at 145.2, we recommend cancelling the position: the market sustains internal changes which were not taken into account.
Summary of technical analysis
| Position | Buy |
| Buy stop | above 145.2 |
| Stop loss | below 138.2 |
Explore our
Trading Conditions
- Spreads from 0.0 pip
- 30,000+ Trading Instruments
- Instant Execution
Ready to Trade?
Open Account Note:
This overview has an informative and tutorial character and is published for free. All the data, included in the overview, are received from public sources, recognized as more or less reliable. Moreover, there is no guarantee that the indicated information is full and precise. Overviews are not updated. The whole information in each overview, including opinion, indicators, charts and anything else, is provided only for familiarization purposes and is not financial advice or а recommendation. The whole text and its any part, as well as the charts cannot be considered as an offer to make a deal with any asset. IFC Markets and its employees under any circumstances are not liable for any action taken by someone else during or after reading the overview.
