- Analytics
- Technical Analysis
Cotton Technical Analysis - Cotton Trading: 2019-11-19
Cotton crop harvesting in the US ends
The U.S. Department of Agriculture (USDA) is expecting a good crop of cotton in USA. Will the Cotton quotations declining?
Based on weekly report published on November 10, 62% of cotton crops in the United States were harvested. On the last week, probably, that share will edge up to 70%. According to the US Commodity Futures Trading Commission, the sales volume of positions (net short position) of the cotton was increased. The industrial group Textile Exchange published a review «2019 Organic Cotton Market Report». It mentions an increase in organic cotton production by 56% to 8-year high. The dynamics of cotton quotes may be affected by the results of US-Chinese trade negotiations.
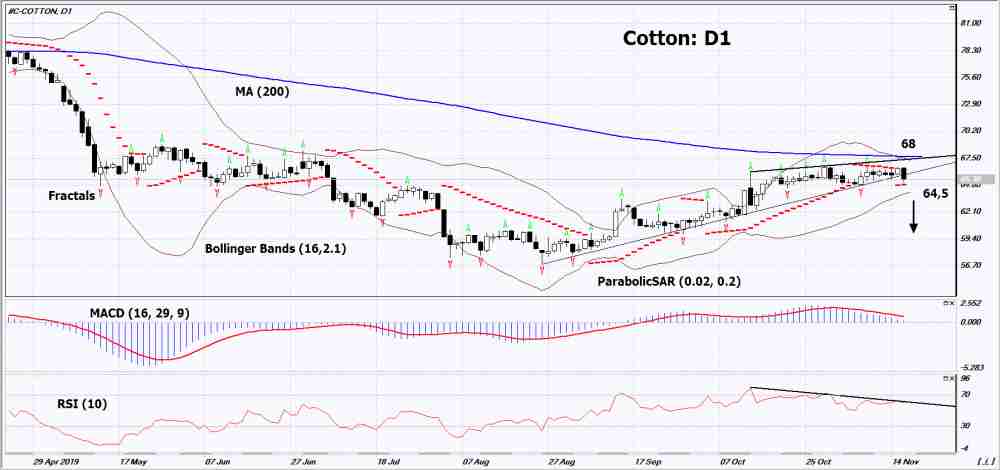
On the daily timeframe, Cotton: D1 has left the rising trend and is correcting down. Most technical analysis indicators formed a signal to decrease. The price decrease is possible in the case of the growth of harvest in the USA and maintaining of high tariffs on US cotton imports to the China.
- The Parabolic Indicator gives a bullish signal. It needs to be used as an additional support level that should be breached down before opening a sell position.
- The Bollinger bands narrowed, indicating a decrease in volatility. The top line has a downward slope.
- The RSI indicator is above 50. It has formed a negative divergence.
- The MACD indicator gives bearish signals.
The bearish momentum may develop in case Cotton drops below the two last fractal lows and the Parabolic signal at 64,5. This level may serve as an entry point. The initial stop loss may be placed above the last fractal high, 200-day moving average line and the upper Bollinger band at 68. After opening the pending order, we shall move the stop to the next fractal high following the Bollinger and Parabolic signals. Thus, we are changing the probable profit/loss ratio to the breakeven point. The most risk-averse traders may switch to the 4-hour chart after the trade and place there a stop-loss moving it in the direction of the trade. If the price meets the stop-loss level at 68 without reaching the order at 64,5, we recommend cancelling the position: the market sustains internal changes, which were not taken into account.
Summary of technical analysis
| Position | Sell |
| Sell stop | Below 64,5 |
| Stop loss | Above 68 |
Explore our
Trading Conditions
- Spreads from 0.0 pip
- 30,000+ Trading Instruments
- Stop Out Level - Only 10%
Ready to Trade?
Open Account Note:
This overview has an informative and tutorial character and is published for free. All the data, included in the overview, are received from public sources, recognized as more or less reliable. Moreover, there is no guarantee that the indicated information is full and precise. Overviews are not updated. The whole information in each overview, including opinion, indicators, charts and anything else, is provided only for familiarization purposes and is not financial advice or а recommendation. The whole text and its any part, as well as the charts cannot be considered as an offer to make a deal with any asset. IFC Markets and its employees under any circumstances are not liable for any action taken by someone else during or after reading the overview.
