- Analytics
- Technical Analysis
EU 50 Index Technical Analysis - EU 50 Index Trading: 2017-02-06
US may become competitor of EU
The pan-European EU Stocks 50 index stopped rising after the protectionist claims by US president Donald Trump. The US economy may become the competitor to the European. Will EU50 index edge lower?
Investors expect total earnings of the companies in the index to have risen more than 10% in Q4 2016. The EU50 index is traded with Р/Е ratio of 21.6. This is high enough to make the index highly sensitive to the earnings data. The European economic indicators look quite positive but may curb the ECB freedom in monetary stimulus. Mario Draghi will speak in Brussels on Monday where he may address economic issues.
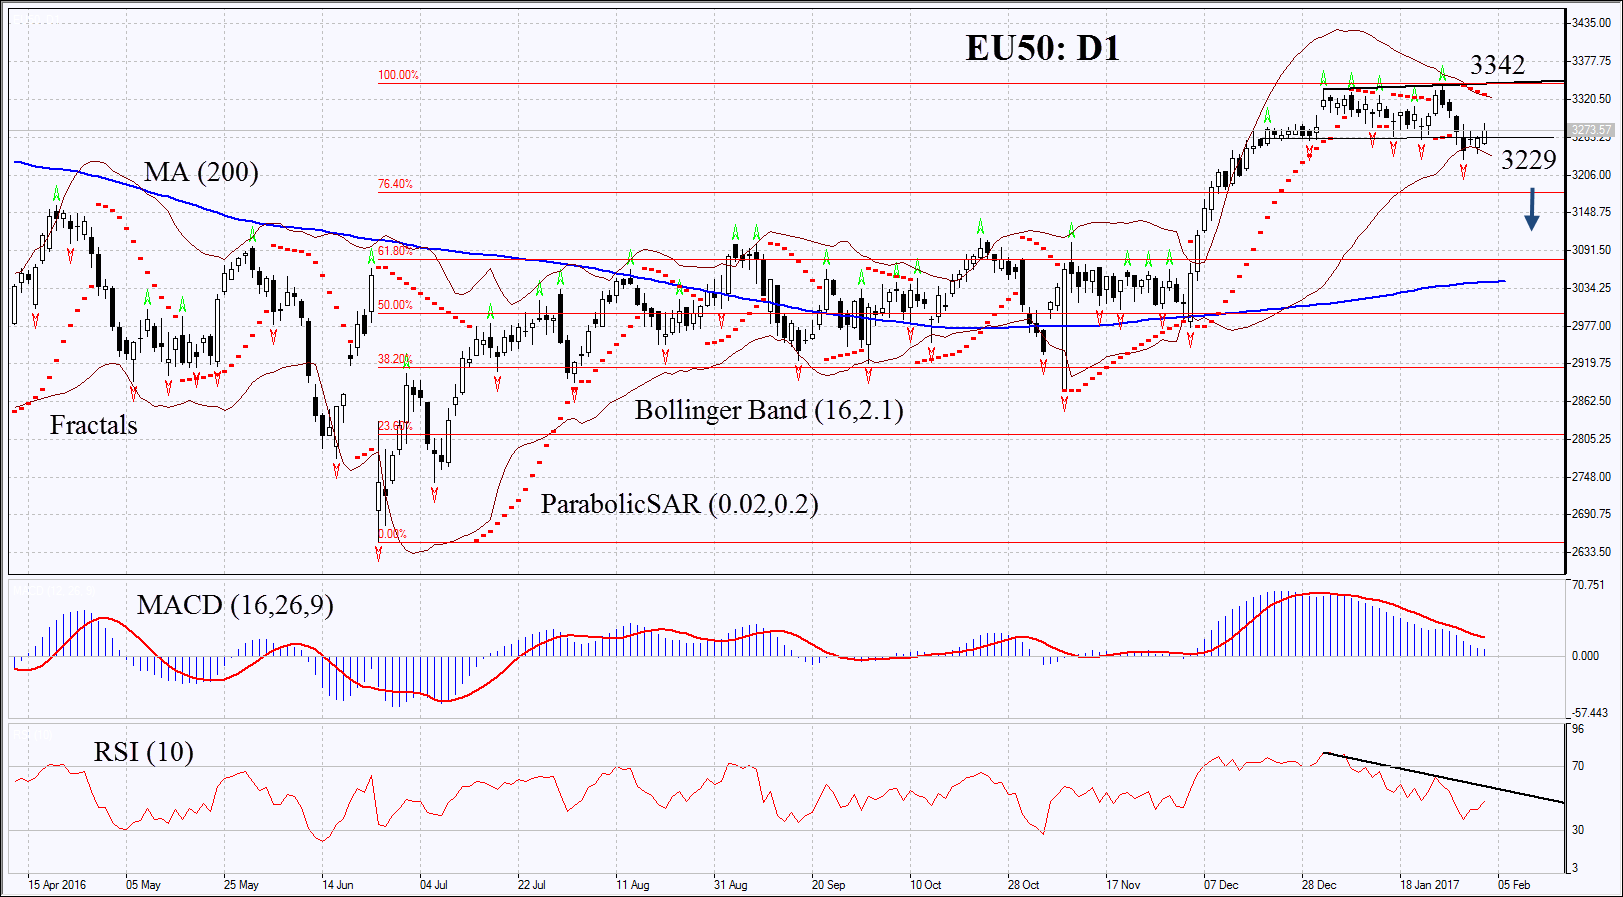
On the daily chart EU50: D1 is slightly correcting down having hit a 13-month high last week. Its further decline is possible in case the negative economic data come out in Eurozone and in case of further protectionist policy in the US.
- The Parabolic indicator gives bearish signal.
- The Bollinger bands have narrowed which means low volatility. They are tilted downward.
- The RSI is below 50. It has formed negative divergence.
- The MACD gives bearish signals.
The bearish momentum may develop in case the EU50 falls below the last fractal low and the Bollinger band at 3229. This level may serve the point of entry. The initial stop-loss may be placed above the 13-month high, the upper Bollinger band and the Parabolic signal at 3342. Having opened the pending order we shall move the stop to the next fractal high following the Parabolic and Bollinger signals. Thus, we are changing the probable profit/loss ratio to the breakeven point. The most risk-averse traders may switch to the 4-hour chart after the trade and place there a stop-loss moving it in the direction of the trade. If the price meets the stop-loss level at 3342 without reaching the order at 3229, we recommend cancelling the position: the market sustains internal changes which were not taken into account.
Summary of technical analysis
| Position | Sell |
| Sell stop | below 3229 |
| Stop loss | above 3342 |
Explore our
Trading Conditions
- Spreads from 0.0 pip
- 30,000+ Trading Instruments
- Instant Execution
Ready to Trade?
Open Account Note:
This overview has an informative and tutorial character and is published for free. All the data, included in the overview, are received from public sources, recognized as more or less reliable. Moreover, there is no guarantee that the indicated information is full and precise. Overviews are not updated. The whole information in each overview, including opinion, indicators, charts and anything else, is provided only for familiarization purposes and is not financial advice or а recommendation. The whole text and its any part, as well as the charts cannot be considered as an offer to make a deal with any asset. IFC Markets and its employees under any circumstances are not liable for any action taken by someone else during or after reading the overview.
