- Analytics
- Technical Analysis
EUR USD Technical Analysis - EUR USD Trading: 2019-12-10
Preparing for Fed and ECB meetings
Positive macroeconomic data were published in the Eurozone. Will the euro continue rising?
Germany's trade surplus in October exceeded forecasts, the September indicator and amounted to 21.5 billion euros. The October current account balance of Germany was also better than expected. The Sentix Investor Confidence indicator for December rose in the EU. The main event of this week for the euro will be the next meeting of the ECB on December 12 and the subsequent statement by its President Christine Lagarde. Before this, the next US Fed meeting will be held on December 11. In both cases, no changes in interest rates are expected, but the EURUSD exchange rate may react to statements by the leaders of the American and European regulators.
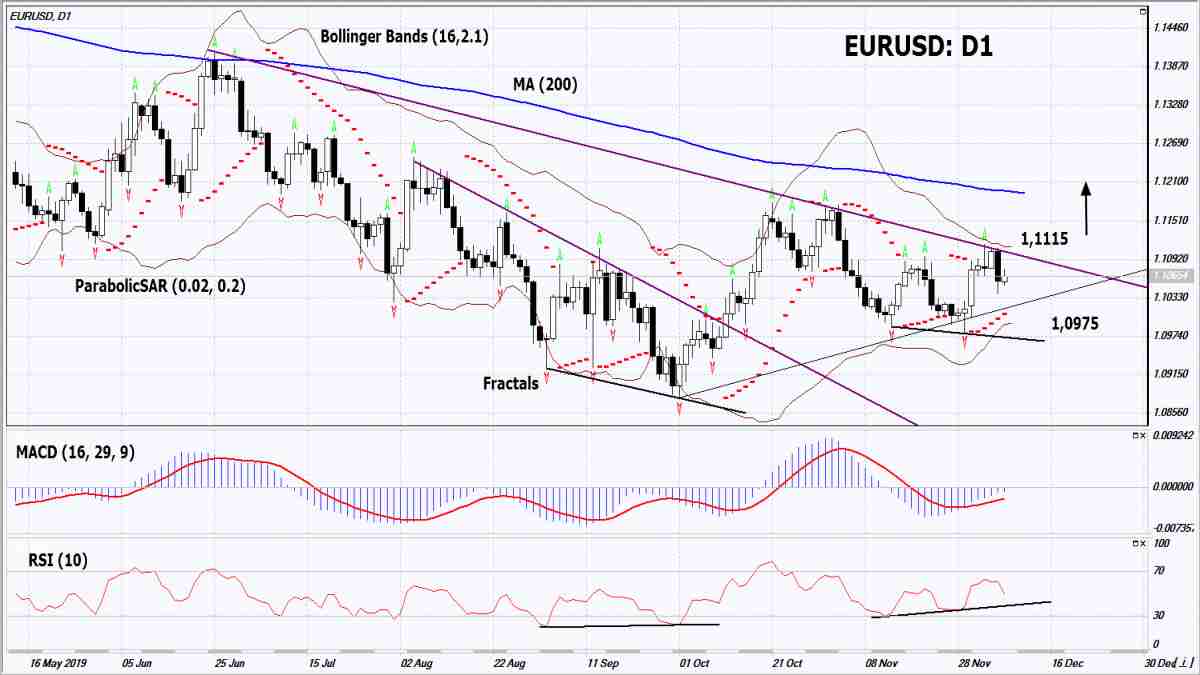
On the daily timeframe, the EURUSD: D1 is correcting up within the triangle. A number of technical analysis indicators formed buy signals. Before opening a buy position, the triangle should be breached up. The further price increase is possible in case of negative news at the US Fed meeting and positive - at the ECB meeting.
- The Parabolic indicator gives a bullish signal.
- The Bollinger bands have narrowed, which indicates low volatility. Both Bollinger bands are titled upward.
- The RSI indicator is below 50. It has formed a positive divergence.
- The MACD indicator gives a bullish signal.
The bullish momentum may develop in case EURUSD exceeds its last fractal high and the upper Bollinger band at 1.1115. This level may serve as an entry point. The initial stop loss may be placed below the last fractal low, the Parabolic signal and the lower Bollinger band at 1.0975. After opening the pending order, we shall move the stop to the next fractal low following the Bollinger and Parabolic signals. Thus, we are changing the potential profit/loss to the breakeven point. More risk-averse traders may switch to the 4-hour chart after the trade and place there a stop loss moving it in the direction of the trade. If the price meets the stop level (1.0975) without reaching the order (1.1115), we recommend closing the position: the market sustains internal changes that were not taken into account.
Summary of technical analysis
| Position | Buy |
| Buy stop | Above 1.1115 |
| Stop loss | Below 1.0975 |
Explore our
Trading Conditions
- Spreads from 0.0 pip
- 30,000+ Trading Instruments
- Stop Out Level - Only 10%
Ready to Trade?
Open Account Note:
This overview has an informative and tutorial character and is published for free. All the data, included in the overview, are received from public sources, recognized as more or less reliable. Moreover, there is no guarantee that the indicated information is full and precise. Overviews are not updated. The whole information in each overview, including opinion, indicators, charts and anything else, is provided only for familiarization purposes and is not financial advice or а recommendation. The whole text and its any part, as well as the charts cannot be considered as an offer to make a deal with any asset. IFC Markets and its employees under any circumstances are not liable for any action taken by someone else during or after reading the overview.
