- Analytics
- Technical Analysis
FCATTLE Technical Analysis - FCATTLE Trading: 2016-10-24
Beef prices advance together with grains
The price of feeder cattle soared last week on steady increase of grain futures prices. Corn, wheat and oats are used to produce mixed cattle feed. Will Fcattle continue rising in price?
Corn prices soared 15% since they hit their low in August 2016. In the same period beef prices slumped 18%. This happened as with higher prices on mixed cattle feed farmers purchase less feeder calves. But if they decide the grain price increase shall be long-term and steady, the demand for calves is to rebound as a rule. Thus, negative correlation between beef and corn prices is changed to the positive. While feeder cattle prices were falling, its sales slumped to the lowest since 2012. In theory it could have caused lower stockpiles of frozen beef.
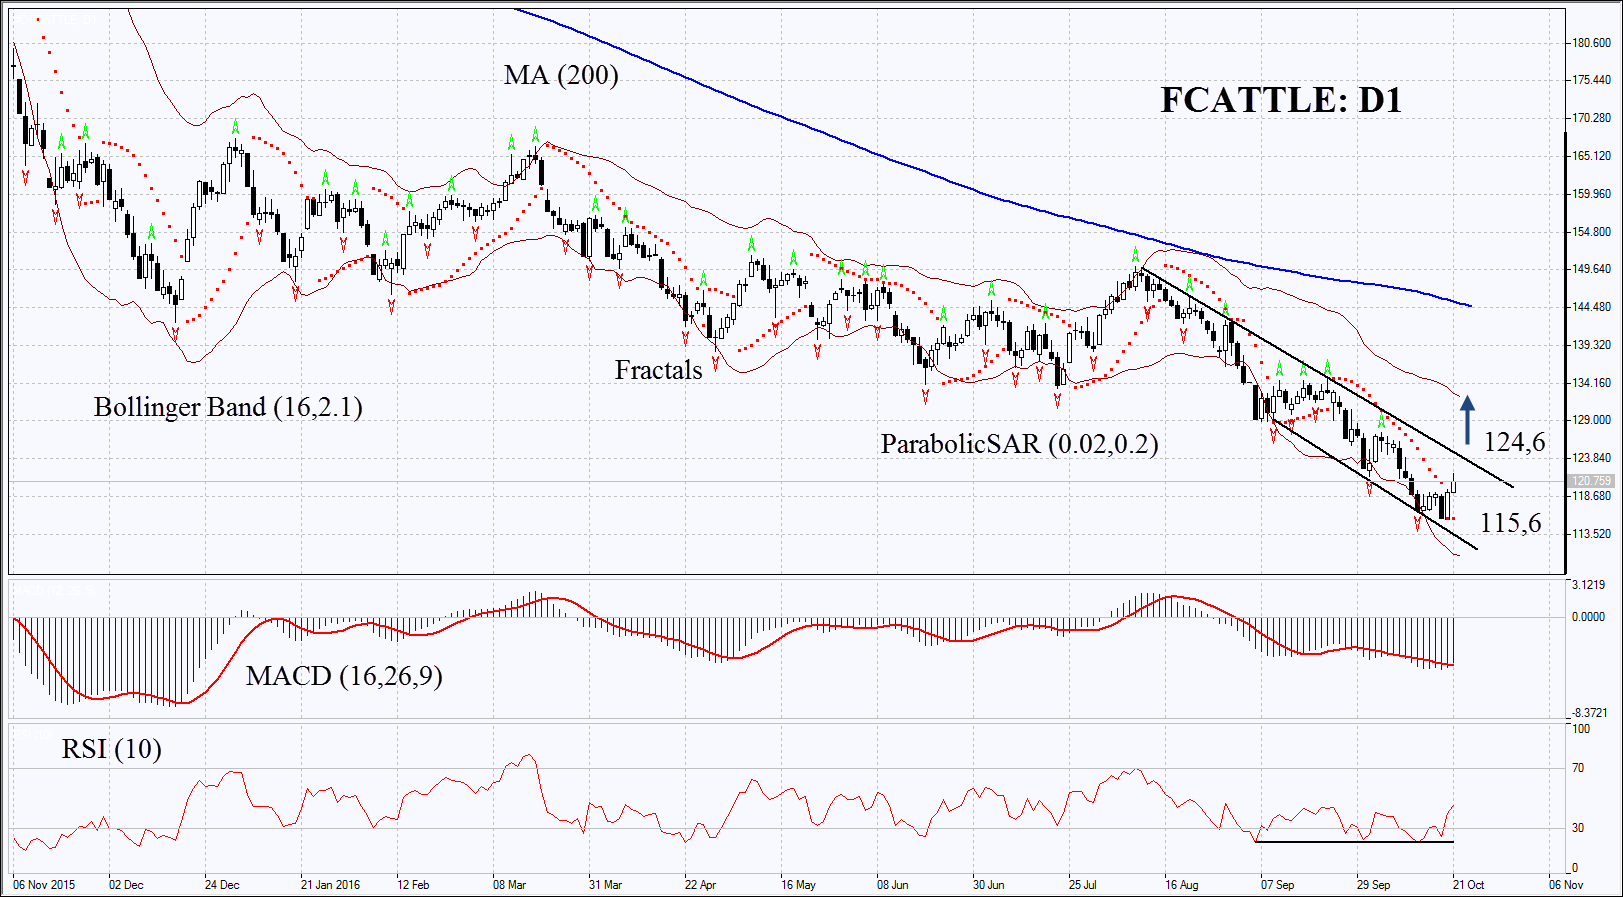
On the daily chart Fcattle: D1 has slumped almost 1.5 times since start of Q2 2016 having hit a fresh 6-year low and are now struggling for growth. Their further increase is possible in case of higher beef prices.
- Parabolic is giving bullisg signals.
- Bollinger bands have widened which means higher volatility.
- RSI is below 50. It has formed positive divergence.
- MACD is giving bullish signals.
The bullish momentum may develop in case the Fcattle surpasses the resistance of the downtrend at 124.6. This level may serve the point of entry. The initial stop-loss may be placed below the Parabolic signal and the last fractal low and 6-year low at 115.6. Having opened the pending order we shall move the stop to the next fractal low following the Parabolic and Bollinger signals. Thus, we are changing the probable profit/loss ratio to the breakeven point. The most risk-averse traders may switch to the 4-hour chart after the trade and place there a stop-loss moving it in the direction of the trade. If the price meets the stop-loss level at 115.6 without reaching the order at 124.6, we recommend cancelling the position: the market sustains internal changes which were not taken into account.
Summary of technical analysis
| Position | Buy |
| Buy stop | above 124.6 |
| Stop loss | below 115.6 |
Explore our
Trading Conditions
- Spreads from 0.0 pip
- 30,000+ Trading Instruments
- Instant Execution
Ready to Trade?
Open Account Note:
This overview has an informative and tutorial character and is published for free. All the data, included in the overview, are received from public sources, recognized as more or less reliable. Moreover, there is no guarantee that the indicated information is full and precise. Overviews are not updated. The whole information in each overview, including opinion, indicators, charts and anything else, is provided only for familiarization purposes and is not financial advice or а recommendation. The whole text and its any part, as well as the charts cannot be considered as an offer to make a deal with any asset. IFC Markets and its employees under any circumstances are not liable for any action taken by someone else during or after reading the overview.
