- Analytics
- Technical Analysis
Nikkei Index Technical Analysis - Nikkei Index Trading: 2016-10-19
Japan’s stock market consolidates ahead of earnings season
Earnings season for Q3 2016 will start in Japan this week. Market participants believe the data may be positive. Nikkei index approached the upper boundary of sideways trend. WIll it continue advancing?
Nikkei stock market index slumped 11% since the start of this year. This is its worst performance among the developed and developing countries except for China, Greece and Italy. Meanwhile, Japanese economic indicators are not at all weak. GDP growth was recorded in Q1 and Q2 2016. Current account balance is constantly positive. TANKAN Business activity index has been positive since 2013. Industrual production has been on the rise since this June to September, or already for 4 months in a row. Speaking of some negative, maximum outflow of foreigh investments has been recorded since 1987. It amounts to $59bn so far this year. The data could have pushed Nikkei index lower. In theory, positive quaterly results could have calmed market participants. The next significant economic data will come out in Japan on October 23: September trade balance. The following BoJ meeting is due on November 1. No additional economic stimulus is anticipated.
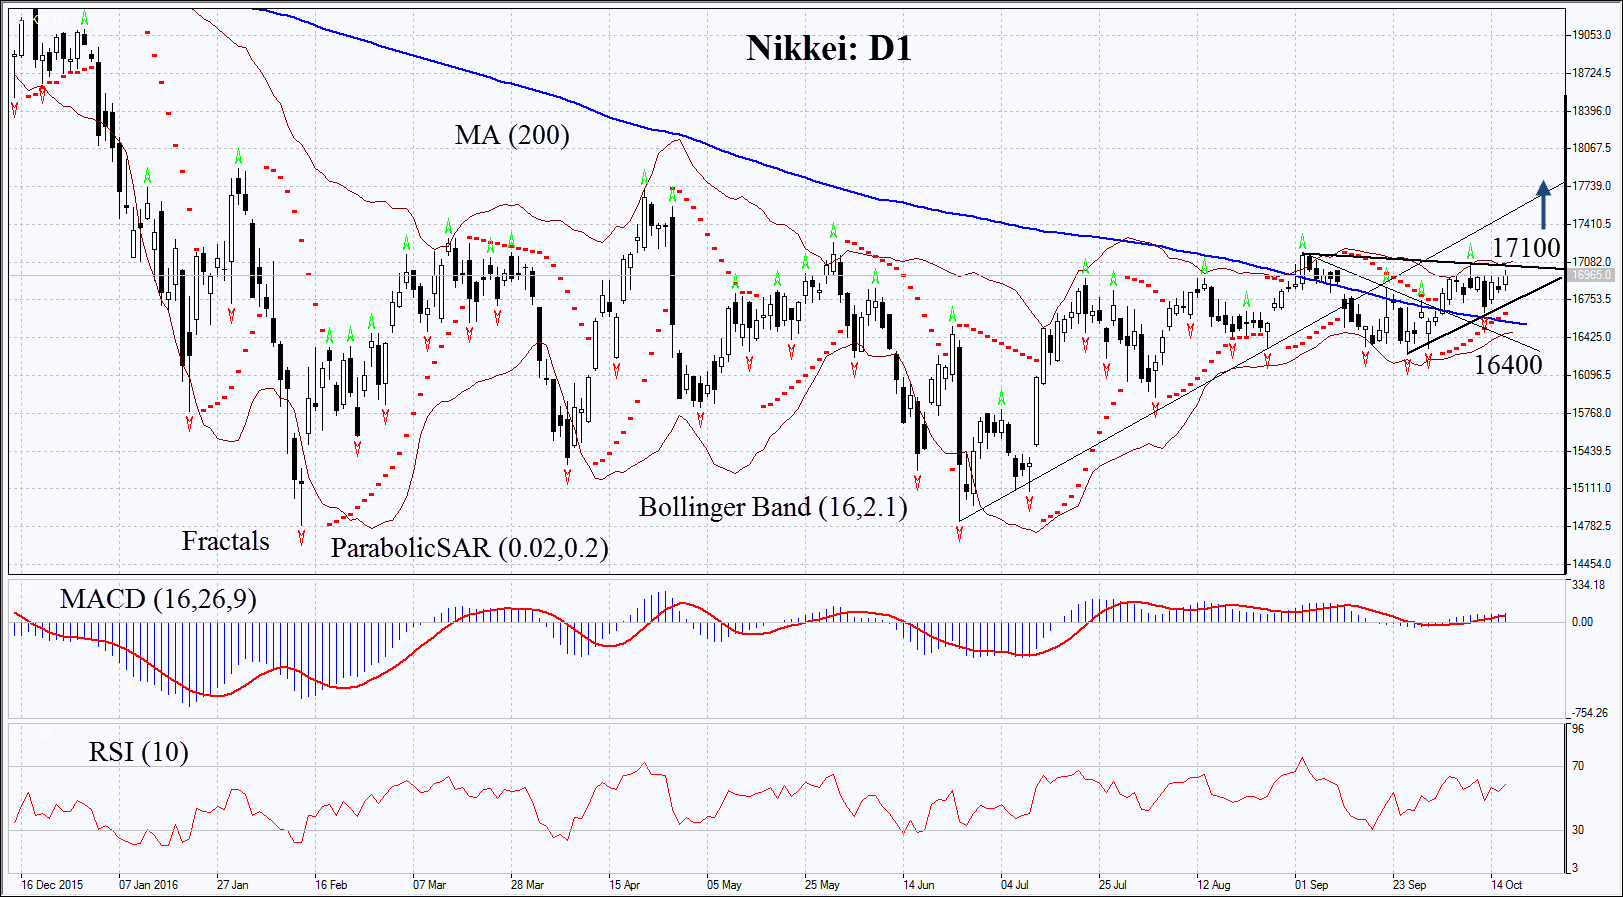
On the daily chart Nikkei: D1 has approached the upper boundary of triangle. Its further increase is possible on positive corporate earnings for Q3 2016.
- Parabolic is giving bullish signals.
- Bollinger bands have narrowed which means lower volatility. They are slightly tilted upwards.
- RSI is above 50, no divergence.
- MACD is giving bullish signals.
The bullish momentum may develop in case the Nikkei index surpasses the last fractal high, triangle boundary and upper Bollinger band at 17100. This level may serve the point of entry. The initial stop-loss may be placed below the lower Bollinger band, the Parabolic signal and the 200-day moving average at 16400. Having opened the pending order we shall move the stop to the next fractal low following the Parabolic and Bollinger signals. Thus, we are changing the probable profit/loss ratio to the breakeven point. The most risk-averse traders may switch to the 4-hour chart after the trade and place there a stop-loss moving it in the direction of the trade. If the price meets the stop-loss level at 16400 without reaching the order at 17100, we recommend cancelling the position: the market sustains internal changes which were not taken into account.
Summary of technical analysis
| Position | Buy |
| Sell stop | above 17100 |
| Stop loss | below 16400 |
Explore our
Trading Conditions
- Spreads from 0.0 pip
- 30,000+ Trading Instruments
- Stop Out Level - Only 10%
Ready to Trade?
Open Account Note:
This overview has an informative and tutorial character and is published for free. All the data, included in the overview, are received from public sources, recognized as more or less reliable. Moreover, there is no guarantee that the indicated information is full and precise. Overviews are not updated. The whole information in each overview, including opinion, indicators, charts and anything else, is provided only for familiarization purposes and is not financial advice or а recommendation. The whole text and its any part, as well as the charts cannot be considered as an offer to make a deal with any asset. IFC Markets and its employees under any circumstances are not liable for any action taken by someone else during or after reading the overview.
