- Analytics
- Technical Analysis
NZD USD Technical Analysis - NZD USD Trading: 2019-10-16
New Zealand slowing inflation bearish for NZDUSD
New Zealand inflation slowed in the third quarter to 1.5% from a year earlier, after the 1.7% pace in the second quarter. Will the NZDUSD continue falling?
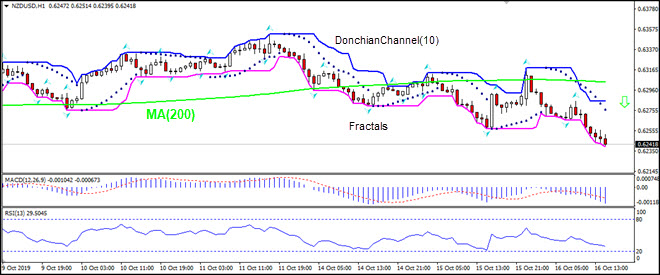
On 1-hour timeframe NZDUSD: H1 is in downtrend, below the 200-period moving average MA(200) which is falling. The RSI indicator is below 50 level but has not reached the oversold zone yet.
Technical Analysis Summary
| Order | Sell |
| Sell stop | Below 0.6240 |
| Stop loss | Above 0.6260 |
- Get Certificate

Note:
This overview has an informative and tutorial character and is published for free. All the data, included in the overview, are received from public sources, recognized as more or less reliable. Moreover, there is no guarantee that the indicated information is full and precise. Overviews are not updated. The whole information in each overview, including opinion, indicators, charts and anything else, is provided only for familiarization purposes and is not financial advice or а recommendation. The whole text and its any part, as well as the charts cannot be considered as an offer to make a deal with any asset. IFC Markets and its employees under any circumstances are not liable for any action taken by someone else during or after reading the overview.
