- Analytics
- Technical Analysis
WTI Crude vs CAD Technical Analysis - WTI Crude vs CAD Trading: 2019-11-05
Getting ready for the publication of significant statistics
In this review, we suggest to consider the OIL vs. CAD personal composite instrument (PCI). It reflects the price dynamics of oil against the Canadian dollar. Will the OIL/CAD quotations grow?
The upward movement is observed with the oil price growth and the weakening of the Canadian dollar. The Bank of Canada kept the rate at 1.75% during its meeting on October 30, 2019. At the same time, the probability of its decline at the next meeting on December 4 increased to 25%. Lower rates may weaken the Canadian dollar. Important macroeconomic data will be published in Canada this week: September trade balance (November 5), Ivey PMI business activity indicator for October (November 6), and labor and construction data (November 8). Oil quotes are now growing pending the conclusion of the first trade agreement between the US and China, as well as due to good data on the US labor market. All this may indicate a reduction in the risks of a slowdown in the global economy.
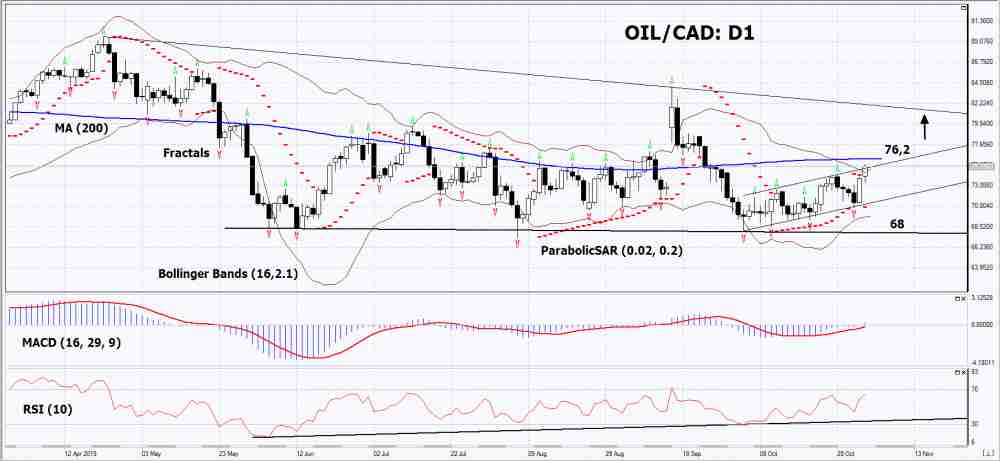
On the daily timeframe OIL/CAD: D1 is in a neutral trend around the 200-day moving average line. Various technical analysis indicators have generated signals to increase. Further growth of quotations is possible in case of successful completion of the US-Chinese trade negotiations and negative economic indicators in Canada.
- The Parabolic indicator demonstrates a signal to increase.
- The Bolinger bands narrowed, indicating a volatility decrease . Both Bollinger Lines Slope Up.
- The RSI indicator is above 50. It has formed a weak divergence to increase.
- The MACD indicator gives a bullish signal.
The bullish momentum may develop if OIL/CAD exceeds the 200-day moving average line: 76.2. This level can be used as an entry point. The initial stop lose may be placed below the last 4 lower fractals, the lower Bollinger line and the Parabolic signal: 68. After opening a pending order, the stop shall be moved following the Bollinger and Parabolic signals to the next fractal minimum. Thus, we are changing the potential profit/loss to the breakeven point. More risk-averse traders may switch to the 4-hour chart after the trade and place a stop loss moving it in the direction of the trade. If the price meets the stop level (68) without reaching the order (76,2), we recommend to cancel the order: the market sustains internal changes that were not taken into account.
Technical Analysis Summary
| Position | Buy |
| Buy stop | Above 76,2 |
| Stop loss | Below 68 |
Explore our
Trading Conditions
- Spreads from 0.0 pip
- 30,000+ Trading Instruments
- Stop Out Level - Only 10%
Ready to Trade?
Open Account Note:
This overview has an informative and tutorial character and is published for free. All the data, included in the overview, are received from public sources, recognized as more or less reliable. Moreover, there is no guarantee that the indicated information is full and precise. Overviews are not updated. The whole information in each overview, including opinion, indicators, charts and anything else, is provided only for familiarization purposes and is not financial advice or а recommendation. The whole text and its any part, as well as the charts cannot be considered as an offer to make a deal with any asset. IFC Markets and its employees under any circumstances are not liable for any action taken by someone else during or after reading the overview.
