- Analytics
- Technical Analysis
Orange Juice Technical Analysis - Orange Juice Trading: 2018-04-16
A reduction in orange crop is expected in Florida
The US Department of Agriculture (USDA) forecasts a reduction in orange crop in Florida by 35% in the 2017/18 season compared to the previous season to 45 million boxes (40.8 kg). Will orange juice prices rise?
Orange crop in Florida is expected to be the lowest in the last 75 years – since 1942. The negative effects of hurricanes and citrus greening disease were the main reasons for this. Note that before the hurricane Irma began, the crop forecast in Florida was 75 million boxes. Expectations of higher orange crop in Brazil may prevent the growth of orange juice prices. According to the forecast of Fundecitrus, in the 2017/18 season, it may amount to 398.3 million boxes, which is 62% more than in the 2016/17 season and a quarter more than the average orange crop in the country over the past 10 years. Currently, it is difficult to say which forecast will have a major impact on price dynamics. Theoretically, the demand for orange juice increases in summer.
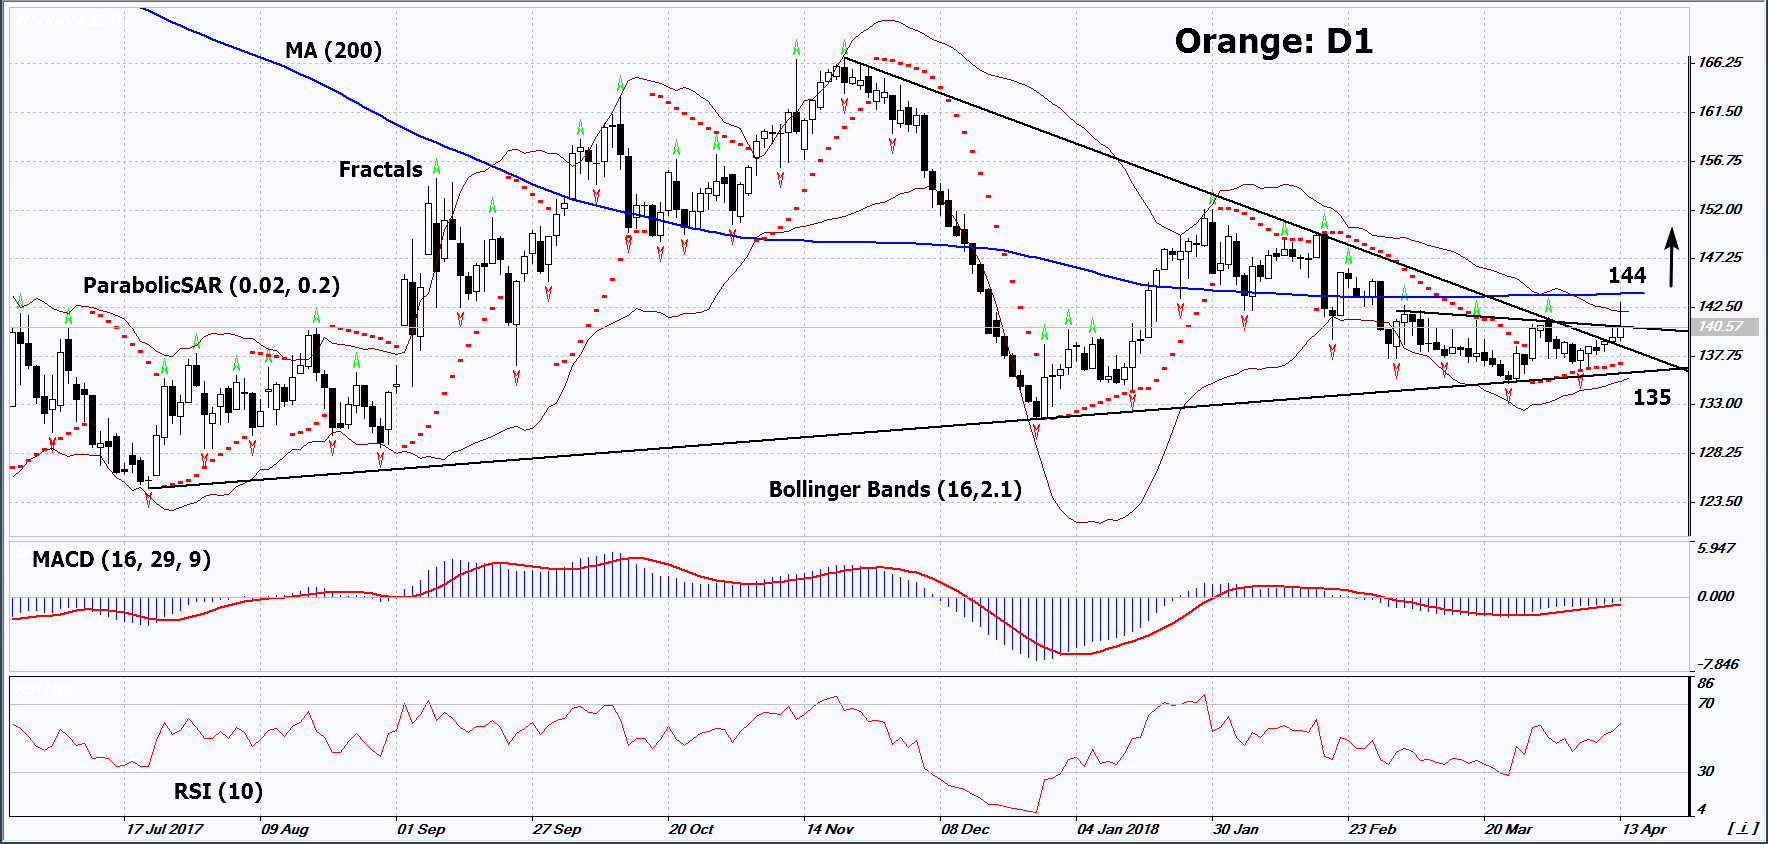
On the daily timeframe, Orange: D1 bounced off from the support line of the uptrend. The further price increase is possible in case of a reduction in the world crop, with high demand in summer.
- The Parabolic indicator gives a bullish signal.
- The Bollinger bands have strongly narrowed, which indicates low volatility. The lower band is titled upward.
- The RSI indicator is above 50. No divergence.
- The MACD indicator gives a bullish signal.
The bullish momentum may develop in case Orange exceeds the three last fractal highs, the 200-day moving average line and the upper Bollinger band at 144. This level may serve as an entry point. The initial stop loss may be placed below the two last fractal lows, the lower Bollinger band and the Parabolic signal at 135. After opening the pending order, we shall move the stop to the next fractal low following the Bollinger and Parabolic signals. Thus, we are changing the potential profit/loss to the breakeven point. More risk-averse traders may switch to the 4-hour chart after the trade and place there a stop loss moving it in the direction of the trade. If the price meets the stop level at 135 without reaching the order at 144 we recommend to close the position: the market sustains internal changes that were not taken into account.
Summary of technical analysis
| Position | Buy |
| Buy stop | Above 144 |
| Stop loss | Below 135 |
Explore our
Trading Conditions
- Spreads from 0.0 pip
- 30,000+ Trading Instruments
- Stop Out Level - Only 10%
Ready to Trade?
Open Account Note:
This overview has an informative and tutorial character and is published for free. All the data, included in the overview, are received from public sources, recognized as more or less reliable. Moreover, there is no guarantee that the indicated information is full and precise. Overviews are not updated. The whole information in each overview, including opinion, indicators, charts and anything else, is provided only for familiarization purposes and is not financial advice or а recommendation. The whole text and its any part, as well as the charts cannot be considered as an offer to make a deal with any asset. IFC Markets and its employees under any circumstances are not liable for any action taken by someone else during or after reading the overview.
