- Analytics
- Technical Analysis
S&P 500 Technical Analysis - S&P 500 Trading: 2017-02-02
Too much optimism over quarterly earnings
US stock indices edged lower after hitting historical highs last week. Investors worry that probable rate hike by the Fed may raise the corporate credit burden. The first acts of US president Donald Trump which have more to do with the politics than with the economy, add uncertainty. Will the downward correction of S&P 500 index continue?
Analysts forecast that total earnings of S&P 500 components shall increase by 7.1% and revenue by 4.2% in Q4 2016 which is quite a high hurdle. The current Р/Е ratio of S&P 500 is 20.6. This is far above the average for the recent 10 years of 14.7. Given the positive earnings expectations, anticipated Р/Е for the following 12 months is 17.6 which is above the average anyway. High Р/Е ratio may signify that stocks are overvalued. 125 companies from S&P 500 index will publish their earnings reports within the next 7 days. Their data may affect the stock indices. The index advanced 1.8% since the start of 2017 and 17.5% in the recent 12 months.
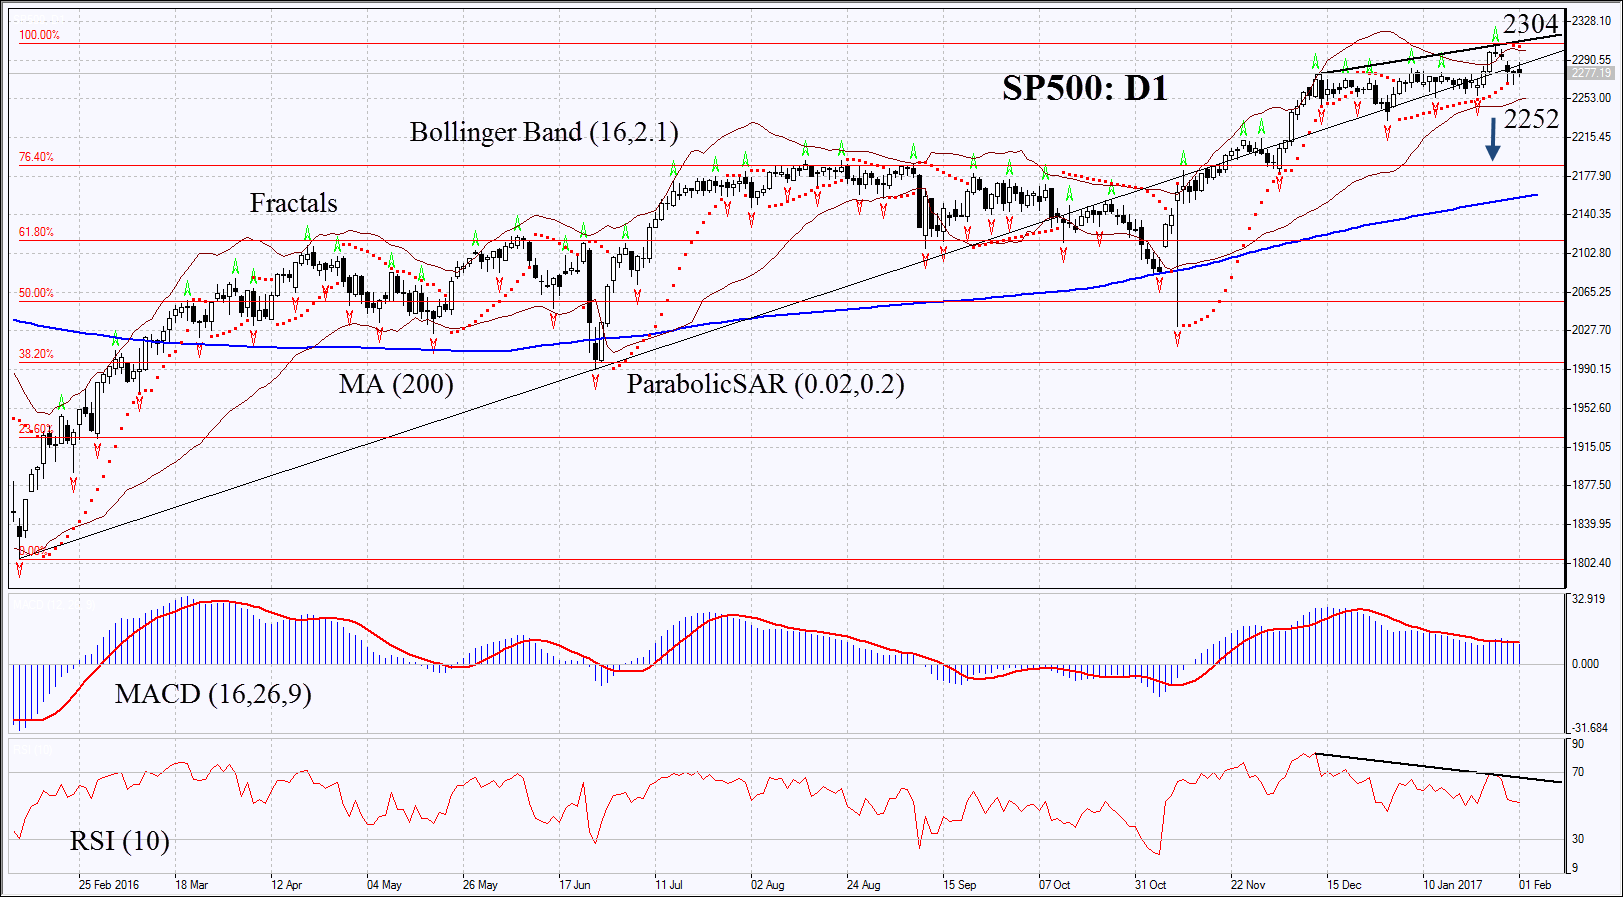
On the daily chart SP500: D1 is slightly correcting down having hit a fresh historical high last week. Its further decline is possible in case the negative corporate and economic data come out in US.
- The Parabolic indicator gives bearish signal.
- The Bollinger bands have narrowed a lot which means low volatility.
- The RSI is close to 50. It has formed negative divergence.
- The MACD indicator gives bearish signals.
The bearish momentum may develop in case S&P 500 falls below two last fractal lows and the Bollinger band at 2252. This level may serve the point of entry. The initial stop-loss may be placed above the Parabolic signal and the last fractal high at 2304. Having opened the pending order we shall move the stop to the next fractal high following the Parabolic and Bollinger signals. Thus, we are changing the probable profit/loss ratio to the breakeven point. The most risk-averse traders may switch to the 4-hour chart after the trade and place there a stop-loss moving it in the direction of the trade. If the price meets the stop-loss level at 2304 without reaching the order at 2252, we recommend cancelling the position: the market sustains internal changes which were not taken into account.
Summary of technical analysis
| Position | Sell |
| Sell stop | below 2252 |
| Stop loss | above 2304 |
Explore our
Trading Conditions
- Spreads from 0.0 pip
- 30,000+ Trading Instruments
- Instant Execution
Ready to Trade?
Open Account Note:
This overview has an informative and tutorial character and is published for free. All the data, included in the overview, are received from public sources, recognized as more or less reliable. Moreover, there is no guarantee that the indicated information is full and precise. Overviews are not updated. The whole information in each overview, including opinion, indicators, charts and anything else, is provided only for familiarization purposes and is not financial advice or а recommendation. The whole text and its any part, as well as the charts cannot be considered as an offer to make a deal with any asset. IFC Markets and its employees under any circumstances are not liable for any action taken by someone else during or after reading the overview.
