- Analytics
- Technical Analysis
SUGAR Technical Analysis - SUGAR Trading: 2017-01-25
Drought does not affect cane sugar yield estimates so far in India
India left the cane sugar production estimates for 2016/17 agricultural season unchanged at 22.5mln tonnes. Some market participants believed them to fall to 20.5mln tonnes. Will sugar prices edge lower?
India’s officials said they are going to precise the forecast in a fortnight. Previously it was thought that drought could have harmed the sowings of sugar cane in Indian Uttar Pradesh, Maharashtra and Karnataka states. This pushed sugar prices up in global markets. Officials of Uttar Pradesh state said on Tuesday that thay expect to produce 8.1mln tonnes of sugar till the end of season in September 2017. This is 19% more than 6.8mln tonnes in previous season. Additional positive for sugar may be news that sugar imports to China fell last December to 220 thousand tonnes which is 56.7% below the level of December 2015. During the year 2016 sugar imports to China slumped to the lowest since 2011 to 3.06mln tonnes. This is 36.8% below the level of 2015. Foreign purchases could have fallen amid sales of sugar of China’s national reserves. 400 thousand tonnes were sold in the end of last year and another 250 tonnes in the beginning of 2017.
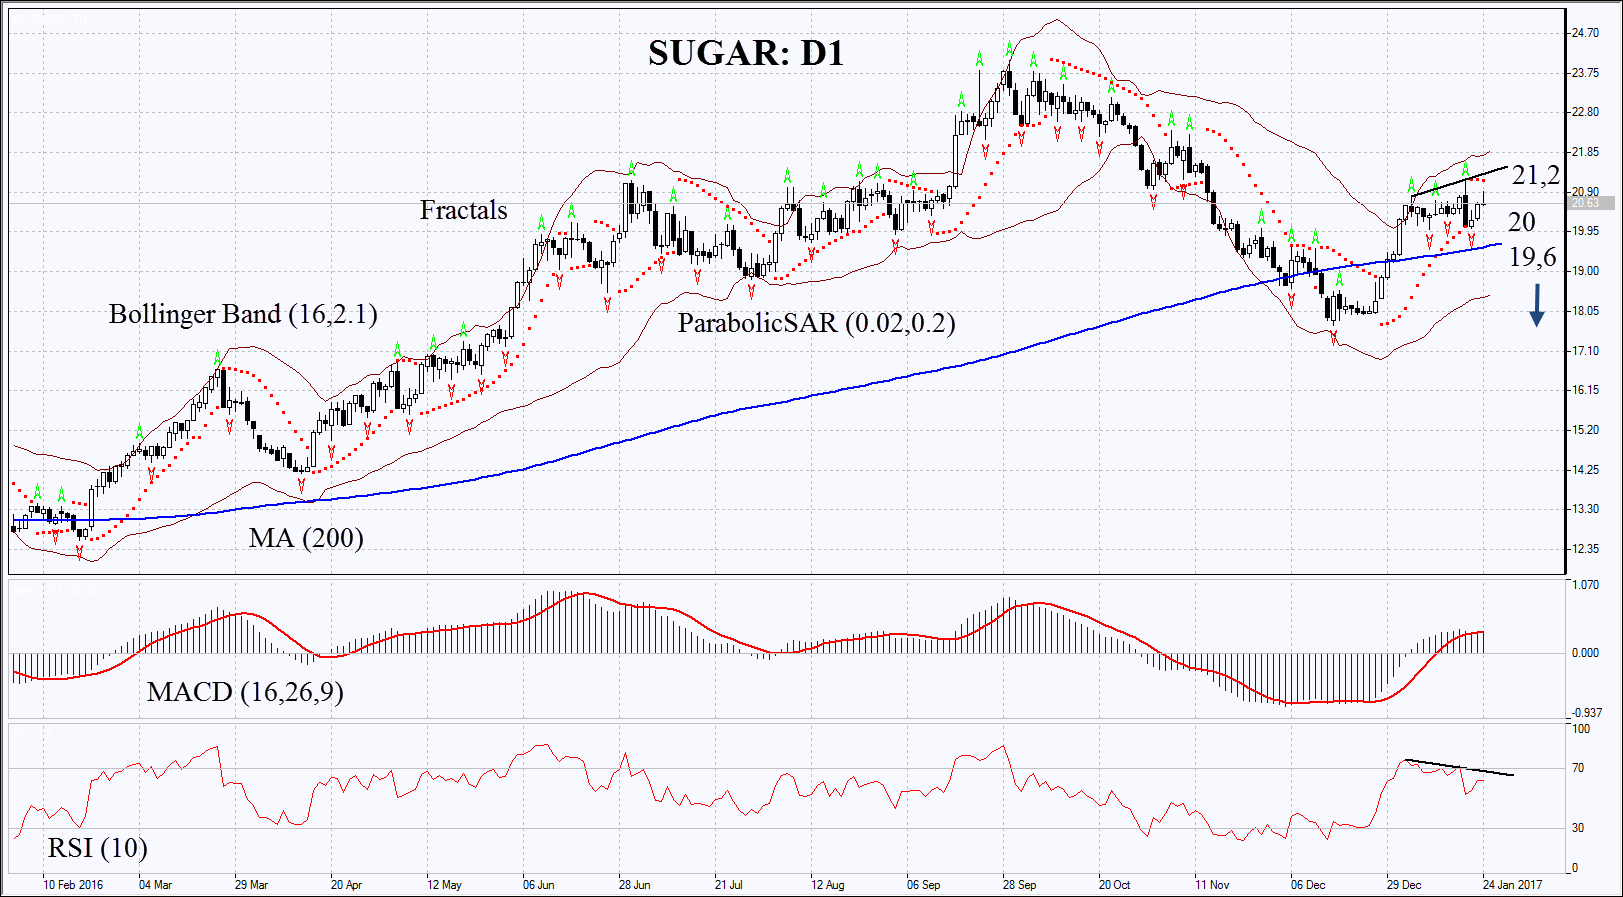
On the daily chart Sugar: D1 is correcting within the sideways channel after slight increase. The decline is possible in case of lower imports to China and high crops in India.
- The Parabolic indicator gives bearish signal.
- The Bollinger bands have widened which means higher volatility.
- The RSI is above 50. It has formed negative divergence.
- The MACD gives bearish signals.
The bearish momentum may develop in case Sugar falls below the three last fractal lows at 20. This level may serve the point of entry. The most risk-averse traders may wait for prices to fall below the 200-day moving average at 19.6. The initial stop-loss may be placed above the Parabolic signal and the last fractal high at 21.2. Having opened the pending order we shall move the stop to the next fractal high following the Parabolic and Bollinger signals. Thus, we are changing the probable profit/loss ratio to the breakeven point. The most risk-averse traders may switch to the 4-hour chart after the trade and place there a stop-loss moving it in the direction of the trade. If the price meets the stop-loss level at 68.7 without reaching the order at 65.3, we recommend cancelling the position: the market sustains internal changes which were not taken into account.
Summary of technical analysis
| Position | Sell |
| Sell stop | below 20-19.6 |
| Stop loss | above 21.2 |
Explore our
Trading Conditions
- Spreads from 0.0 pip
- 30,000+ Trading Instruments
- Instant Execution
Ready to Trade?
Open Account Note:
This overview has an informative and tutorial character and is published for free. All the data, included in the overview, are received from public sources, recognized as more or less reliable. Moreover, there is no guarantee that the indicated information is full and precise. Overviews are not updated. The whole information in each overview, including opinion, indicators, charts and anything else, is provided only for familiarization purposes and is not financial advice or а recommendation. The whole text and its any part, as well as the charts cannot be considered as an offer to make a deal with any asset. IFC Markets and its employees under any circumstances are not liable for any action taken by someone else during or after reading the overview.
