- Analytics
- Technical Analysis
SUGAR Technical Analysis - SUGAR Trading: 2018-08-07
World harvest may decline because of drought
Will the increase in sugar prices continue amid drought in Europe, as well as in the southern and central parts of Brazil?
The EU countries and Brazil account for up to 30% of the world sugar production. The recent strengthening of the Brazilian real contributed to the increase in sugar prices. In addition, the South Indian Sugar Mills Association (SISMA) forecasts a 40% decline in sugarcane production in South India during the next 4 years. Another factor for the technical price increase may be the closure of short positions on sugar. According to the US Commodity Futures Trading Commission, on July 31, their volume reached the high since May of the current year. Let us recall that in May their reduction provoked an upward correction.
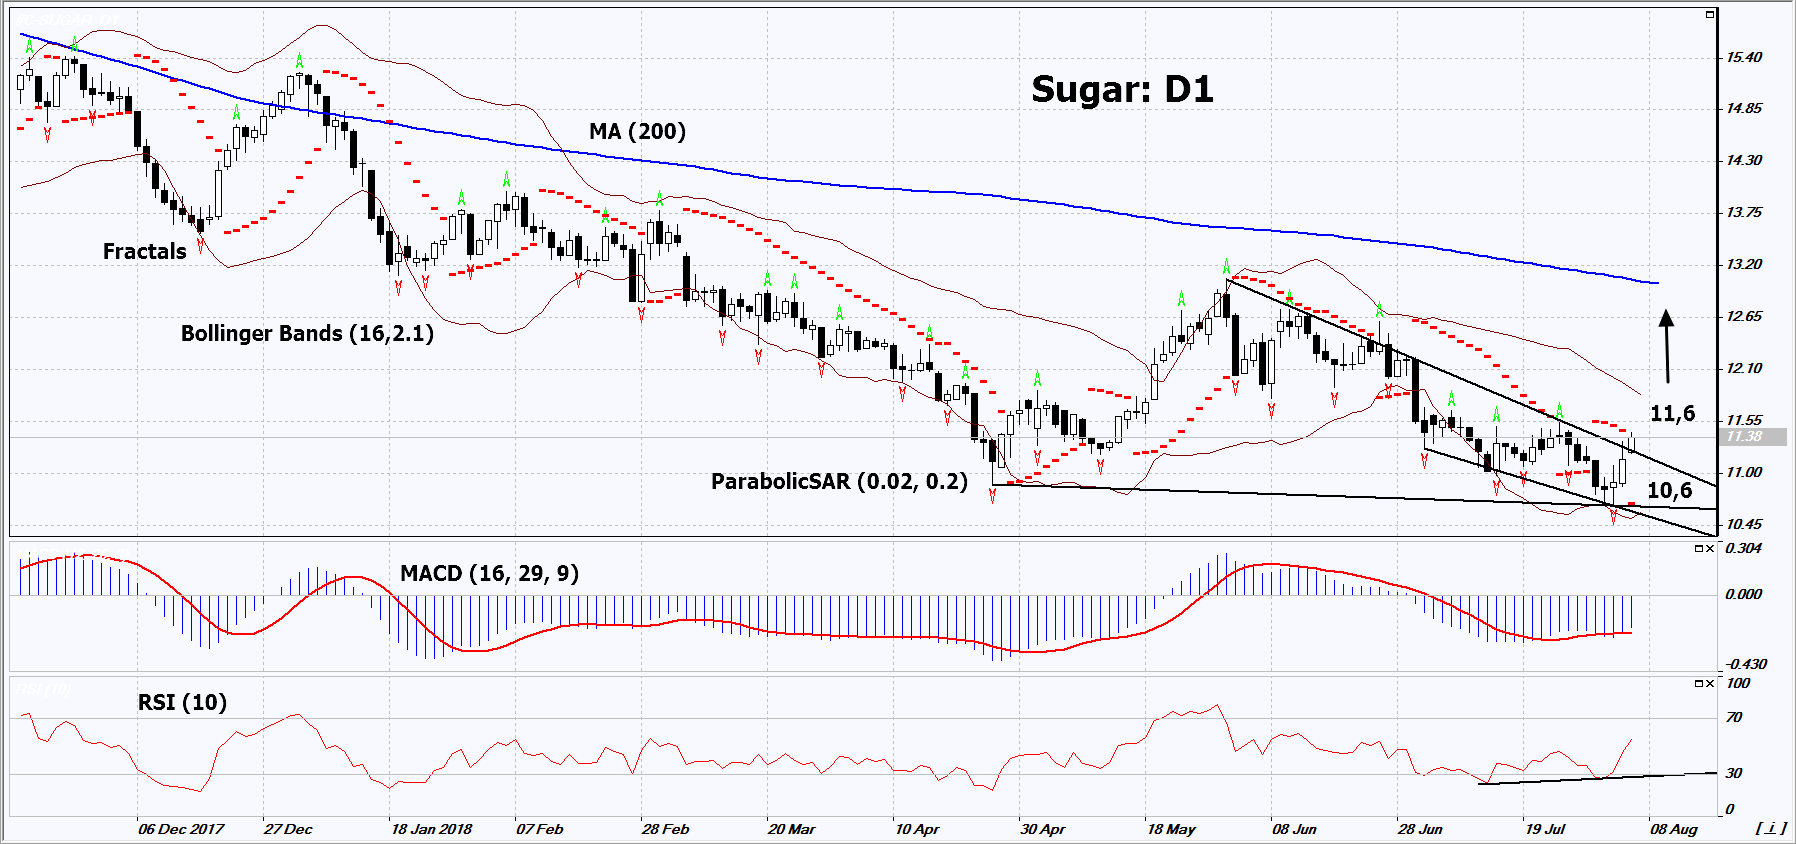
On the daily timeframe, Sugar: D1 breached up the resistance line of the downtrend and formed a double bottom at the level of the 3-year low. The further price increase is possible in case of a decline in the world harvest.
- The Parabolic indicator gives a bullish signal.
- The Bollinger bands have widened, which indicates high volatility. The lower band is titled upward.
- The RSI indicator is above 50. It has formed a positive divergence.
- The MACD indicator gives a bullish signal.
The bullish momentum may develop in case Sugar exceeds the last fractal high at 11.6. This level may serve as an entry point. The initial stop loss may be placed below the last fractal low, the Parabolic signal and the 3-year low at 10.6. After opening the pending order, we shall move the stop to the next fractal low following the Bollinger and Parabolic signals. Thus, we are changing the potential profit/loss to the breakeven point. More risk-averse traders may switch to the 4-hour chart after the trade and place there a stop loss moving it in the direction of the trade. If the price meets the stop level (10.6) without reaching the order (11.6), we recommend to close the position: the market sustains internal changes that were not taken into account.
Summary of technical analysis
| Position | Buy |
| Buy stop | Above 11.6 |
| Stop loss | Below 10.6 |
Explore our
Trading Conditions
- Spreads from 0.0 pip
- 30,000+ Trading Instruments
- Stop Out Level - Only 10%
Ready to Trade?
Open Account Note:
This overview has an informative and tutorial character and is published for free. All the data, included in the overview, are received from public sources, recognized as more or less reliable. Moreover, there is no guarantee that the indicated information is full and precise. Overviews are not updated. The whole information in each overview, including opinion, indicators, charts and anything else, is provided only for familiarization purposes and is not financial advice or а recommendation. The whole text and its any part, as well as the charts cannot be considered as an offer to make a deal with any asset. IFC Markets and its employees under any circumstances are not liable for any action taken by someone else during or after reading the overview.
