- Analytics
- Technical Analysis
USD CAD Technical Analysis - USD CAD Trading: 2014-11-21
Core price index and Canadian dollar
Today at 14:30 (CET) we expect the release of Core CPI which reflects the inflation trend of the Canadian economy. The index is published by the Statistics Canada and measures a change in the price of goods and services, excluding the 8 most volatile items. This indicator determines the inflation rate, which in turn affects the monetary policy and the interest rate established by the Bank of Canada. The Bank’s Governing Council takes the inflation expectations into account to limit the excessive pace of its growth due to the policy tightening. The rate hike leads to investment funds inflow in the country’s economy: this is the reason why CPI release may have a significant impact on the Canadian currency rate against its most liquid competitors.
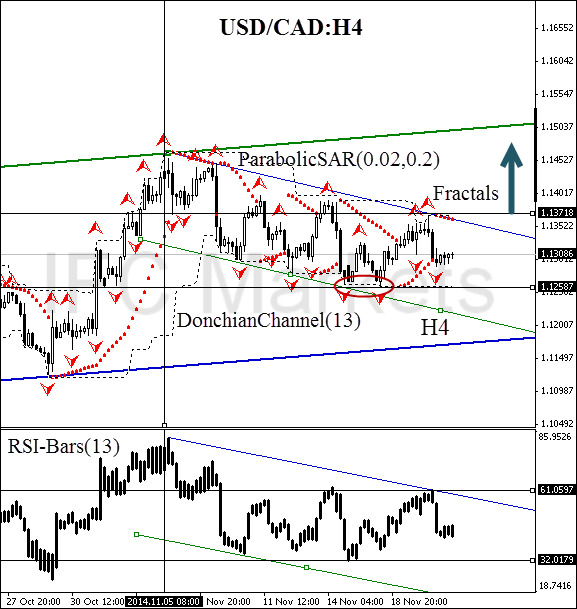
After position opening, Stop Loss is to be moved after the Parabolic values, near the next fractal low. Updating is enough to be done every day after a new Bill Williams fractal formation (5 candlesticks). Thus, we are changing the probable profit/loss ratio to the breakeven point.
| Position | Buy |
| Buy stop | above 1.13718 |
| Stop loss | below 1.12587 |
Dear traders. For the detailed report of the strategy based on analytical issues of technical analysis click here.
Explore our
Trading Conditions
- Spreads from 0.0 pip
- 30,000+ Trading Instruments
- Stop Out Level - Only 10%
Ready to Trade?
Open Account Note:
This overview has an informative and tutorial character and is published for free. All the data, included in the overview, are received from public sources, recognized as more or less reliable. Moreover, there is no guarantee that the indicated information is full and precise. Overviews are not updated. The whole information in each overview, including opinion, indicators, charts and anything else, is provided only for familiarization purposes and is not financial advice or а recommendation. The whole text and its any part, as well as the charts cannot be considered as an offer to make a deal with any asset. IFC Markets and its employees under any circumstances are not liable for any action taken by someone else during or after reading the overview.
