- Analytics
- Technical Analysis
USD CAD Technical Analysis - USD CAD Trading: 2014-12-03
BOC Rate Statement
Today we expect the release of two indicators which can affect significantly the Canadian dollar volatility. In the first place, ADP Non-Farm Employment Change will be published at 14:15 CET, released monthly by Automatic Data Processing. The parameters are based on the study of anonymous data from around 400.000 US business clients, excluding the farming industry and government. The preliminary estimate of employment rate is released two days before the publication of Nonfarm. That is why this indicator is worth a closer look. Employment rate is the key factor influencing the US consumer demand. If the index falls below the expected value, it will almost certainly result in the US currency weakening. Two hours later the Bank of Canada will publish the Rate Statement and cast light upon the economic situation development. We assume that the oil market restructuring and fallen energy prices may lead to the monetary policy revision of the largest exporter in favour of easing.
Here we consider the USDCAD currency pair on the D1 chart. The price is moving in the limits of W1 and D1 bullish trend, containing the rising Donchian Channel. Parabolic values are moving along the D1 trend line, confirming the trend direction. The final oscillator confirmation will be obtained after the local resistance level breakout at 73.2061%: this level is strengthened by “triple top” chart pattern, marked in red ellipse. In our opinion, this event will coincide with the price level intersection at 1.14735. This mark can be used for opening a pending buy order with Stop Loss placed below 1.11785. Both levels are confirmed by Donchian Channel boundaries, Parabolic historical values and Bill Williams fractals.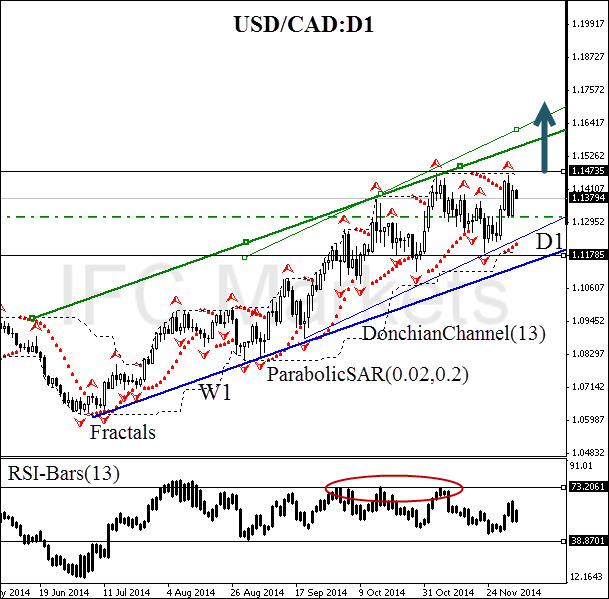
| Position | Buy |
| Buy stop | above 1.14735 |
| Stop loss | below 1.11785 |
Explore our
Trading Conditions
- Spreads from 0.0 pip
- 30,000+ Trading Instruments
- Stop Out Level - Only 10%
Ready to Trade?
Open Account Note:
This overview has an informative and tutorial character and is published for free. All the data, included in the overview, are received from public sources, recognized as more or less reliable. Moreover, there is no guarantee that the indicated information is full and precise. Overviews are not updated. The whole information in each overview, including opinion, indicators, charts and anything else, is provided only for familiarization purposes and is not financial advice or а recommendation. The whole text and its any part, as well as the charts cannot be considered as an offer to make a deal with any asset. IFC Markets and its employees under any circumstances are not liable for any action taken by someone else during or after reading the overview.
