- Analytics
- Technical Analysis
USD CAD Technical Analysis - USD CAD Trading: 2019-11-08
Lower than expected Canada housing starts bullish for USDCAD
Housing starts declined in Canada in October. Will the USDCAD rise?
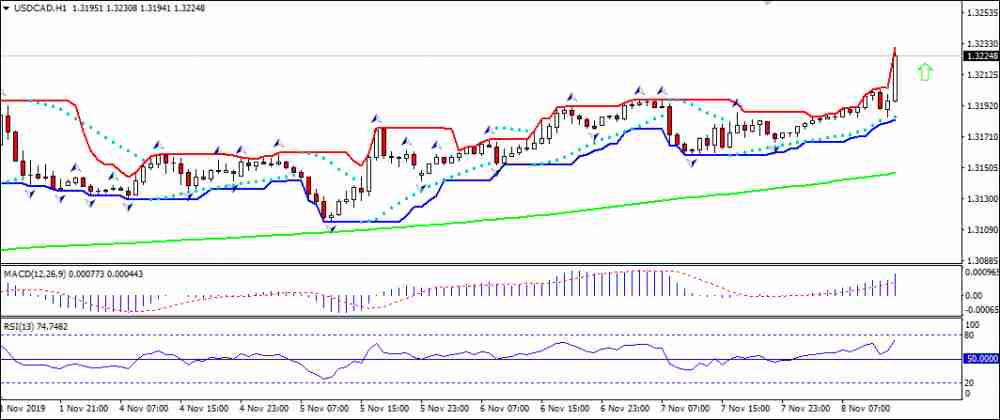
The price chart on 1-hour timeframe shows USDCAD: H1 is in uptrend. The price is rising above the 200-period moving average MA(200) which is rising. The RSI oscillator is above 50 level but has not reached the overbought zone.
Technical Analysis Summary
| Order | Buy |
| Buy stop | Above 1.3204 |
| Stop loss | Below 1.3184 |
- Get Certificate

Note:
This overview has an informative and tutorial character and is published for free. All the data, included in the overview, are received from public sources, recognized as more or less reliable. Moreover, there is no guarantee that the indicated information is full and precise. Overviews are not updated. The whole information in each overview, including opinion, indicators, charts and anything else, is provided only for familiarization purposes and is not financial advice or а recommendation. The whole text and its any part, as well as the charts cannot be considered as an offer to make a deal with any asset. IFC Markets and its employees under any circumstances are not liable for any action taken by someone else during or after reading the overview.
