- Analytics
- Technical Analysis
USD CHF Technical Analysis - USD CHF Trading: 2016-12-08
Awaiting ECB meeting
On Thursday December 8, 2016 the next ECB meeting will be held where the Bank may announce expansion of its bond-buying program. Today we will examine the chart of Swiss franc. In theory, it may strengthen on emission of euro.
Investors expect ECB bond-buying program that ends in March to be extended farther. Moreover, its volume of 1.4trn euros may be increased. This will let ECB raise the monthly bond purchases from 60bn/ to 80bn/ euros. As to the Swiss economy, factory orders rose there 6.6% in Q3 2016 which is the almost 5-year high. Another positive for Swiss franc is higher ZEW indicator of economic sentiment in November which reached the 5-month high as well currency reserves which rose 2.8% to $648bn. Deflation rose in November to -0.3% YoY. The The next significant event in Switzerland will be the SNB meeting on December 15, 2016. No rate changes are expected. Since previous January the rates have been negative.
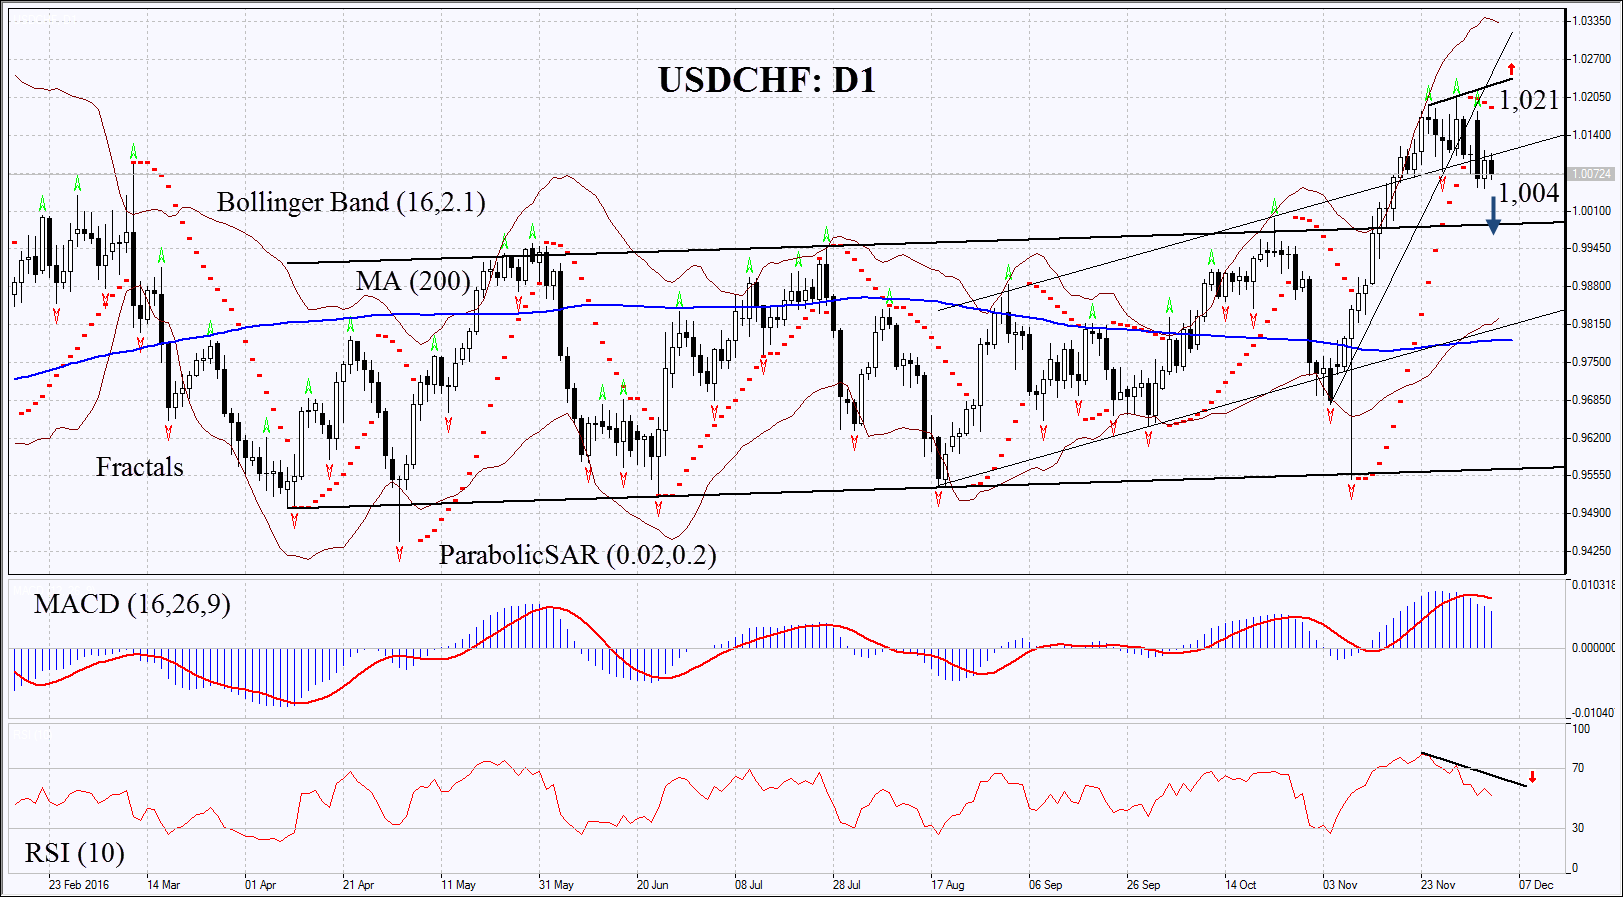
On the daily chart USDCHF: D1 has left the neutral trend to move upwards. Now it is correcting down and the upper boundary of the previous range became the level of support. Further decline will mean that Swiss franc is strengthening. It may continue in case of strong economic indicators amid other countries and it the interest rate remains unchanged.
- Parabolic gives bearish signal.
- Bollinger bands have widened a lot which means higher volatlilty.
- RSI is near 50. It has formed negative divergence (marked with red arrows).
- MACD gives bearish signals.
The bearish momentum may develop in case Swiss franc falls below this week low of 1.004. This level may serve the point of entry. The initial stop-loss may be placed above the Parabolic signal and the two last fractal highs at 1.021. Having opened the pending order we shall move the stop to the next fractal high following the Parabolic and Bollinger signals. Thus, we are changing the probable profit/loss ratio to the breakeven point. The most risk-averse traders may switch to the 4-hour chart after the trade and place there a stop-loss moving it in the direction of the trade. If the price meets the stop-loss level at 1.021 without reaching the order at 1.004, we recommend cancelling the position: the market sustains internal changes which were not taken into account.
Summary of technical analysis
| Position | Sell |
| Sell stop | below 1.004 |
| Stop loss | above 1.021 |
Explore our
Trading Conditions
- Spreads from 0.0 pip
- 30,000+ Trading Instruments
- Instant Execution
Ready to Trade?
Open Account Note:
This overview has an informative and tutorial character and is published for free. All the data, included in the overview, are received from public sources, recognized as more or less reliable. Moreover, there is no guarantee that the indicated information is full and precise. Overviews are not updated. The whole information in each overview, including opinion, indicators, charts and anything else, is provided only for familiarization purposes and is not financial advice or а recommendation. The whole text and its any part, as well as the charts cannot be considered as an offer to make a deal with any asset. IFC Markets and its employees under any circumstances are not liable for any action taken by someone else during or after reading the overview.
