- Analytics
- Technical Analysis
XAUUSD Technical Analysis - XAUUSD Trading: 2017-09-07
North Korea tensions and dovish Fed talk support gold prices
Geopolitical tensions and diminishing prospects for another Fed interest rate hike this year are bullish for gold. Will XAUUSD continue rising?
Gold price is rising with rising tensions around North Korea. At the same time growing concerns President Trump is facing an uphill battle to enact stimulus policies like tax overhaul and infrastructure spending programs have weighed on dollar, lifting gold. On Tuesday two Federal Reserve officials signaled Federal their support for slower pace of further rate hikes. Federal Reserve Governor Lael Brainard said Fed may have to slow interest-rate hikes given subdued inflation. Minneapolis Fed President Neel Kashkari said Tuesday it is very possible that the central bank's four interest rate hikes since late 2015 could now be doing "real harm" to the economy. Slower pace of rate hikes is bullish for gold.
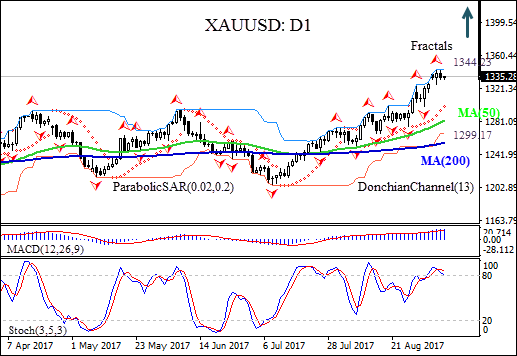
The XAUUSD: D1 has risen above the 200-day and 50-day moving averages MA(200) and MA(50) on the daily chart, which are both rising.
- Parabolic indicator gives a buy signal.
- The Donchian channel indicates no trend yet: it is flat.
- The MACD indicator is above the signal line and the gap is widening, this is bulliish.
- The stochastic oscillator is falling back from the overbaught zone.
We believe the bullish momentum will continue after the price closes above the upper Donchian boundary at $1344.23. A pending order to buy can be placed above that level. The stop loss can be placed below the fractal low at $1299.17. After placing the order, the stop loss is to be moved every day to the next fractal high, following Parabolic signals. Thus, we are changing the probable profit/loss ratio to the breakeven point. The most risk-averse traders may switch to the 4-hour chart after the trade and place there a stop-loss moving it in the direction of the trade. If the price meets the stop loss level ($1299.17) without reaching the order ($1344.23), we recommend canceling the position: the market sustains internal changes which were not taken into account.
Technical Analysis Summary
| Position | Buy |
| Buy stop | Above 1344.23 |
| Stop loss | Below 1299.17 |
Explore our
Trading Conditions
- Spreads from 0.0 pip
- 30,000+ Trading Instruments
- Stop Out Level - Only 10%
Ready to Trade?
Open Account Note:
This overview has an informative and tutorial character and is published for free. All the data, included in the overview, are received from public sources, recognized as more or less reliable. Moreover, there is no guarantee that the indicated information is full and precise. Overviews are not updated. The whole information in each overview, including opinion, indicators, charts and anything else, is provided only for familiarization purposes and is not financial advice or а recommendation. The whole text and its any part, as well as the charts cannot be considered as an offer to make a deal with any asset. IFC Markets and its employees under any circumstances are not liable for any action taken by someone else during or after reading the overview.
