- Analytics
- Trading Ideas
Trading Idea - Goldman Sachs, 07-12-2023
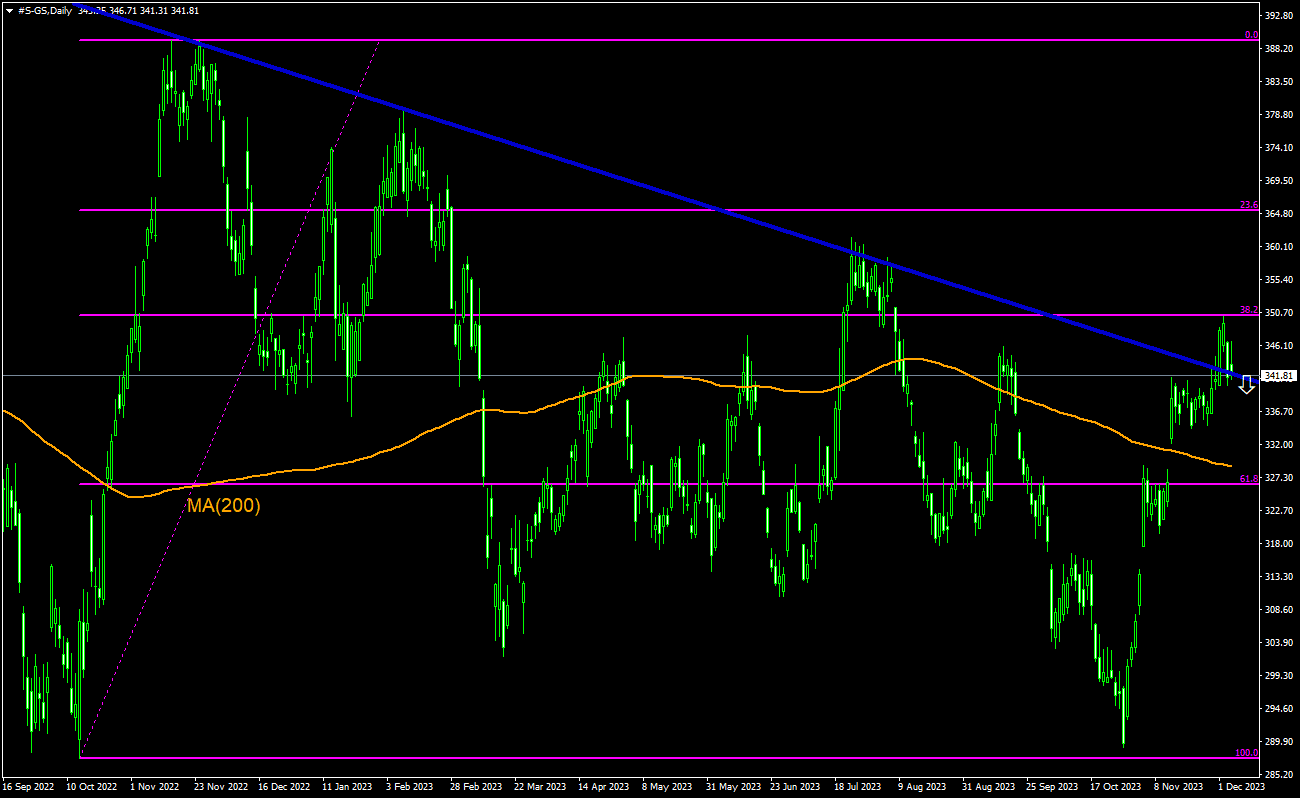
Trading Signal: #S-GS
| Order | Sell |
| Direction | Bearish |
| Pattern | Resistance Line Breach |
| Interval | Daily |
| Length (Candles) | 7 |
Idea Summary
The medium term Goldman Sachs stock price forecast is bearish. The GS stock price is testing a resistance after breaching above it and reflecting off Fibonacci 38.2 level. Most likely the price will continue falling and return below resistance to test the 200-period moving average MA(200) while there is a likelihood it may reverse and start rising to test again the Fibonacci 38.2 level.


Note:
This overview has an informative and tutorial character and is published for free. All the data, included in the overview, are received from public sources, recognized as more or less reliable. Moreover, there is no guarantee that the indicated information is full and precise. Overviews are not updated. The whole information in each overview, including opinion, indicators, charts and anything else, is provided only for familiarization purposes and is not financial advice or а recommendation. The whole text and its any part, as well as the charts cannot be considered as an offer to make a deal with any asset. IFC Markets and its employees under any circumstances are not liable for any action taken by someone else during or after reading the overview.
- Get Certificate
