- Analytics
- Technical Analysis
Australian Stock Index Technical Analysis - Australian Stock Index Trading: 2019-03-27
Risks of a slowdown in the global economy may lower S&P / ASX 200 index
Australian stock prices fell amid signs of a slowdown in the global economy. Will the AU200 stock index fall?
In Australia, the Manufacturing PMI and Consumer Sentiment macroeconomic indicators decreased in March. Earlier, the US Federal Reserve announced the risks of a global recession, which may stop the rate hike policy. In March, China published very weak statistics for February. The trade balance surplus, the industrial production, the lending volume in RMB and a number of other indicators decreased. Note that banks account for 60% in the AU200 index capitalization, as well as industrial and mining companies. China is the main buyer of Australian raw materials. Australian banks may reduce revenues in case of a global rate cut. The next meeting of the Reserve Bank of Australia will take place on April 2. No changes in the rate (1.5%) are expected, but statements by representatives of the regulator may affect the dynamics of Australian stocks.
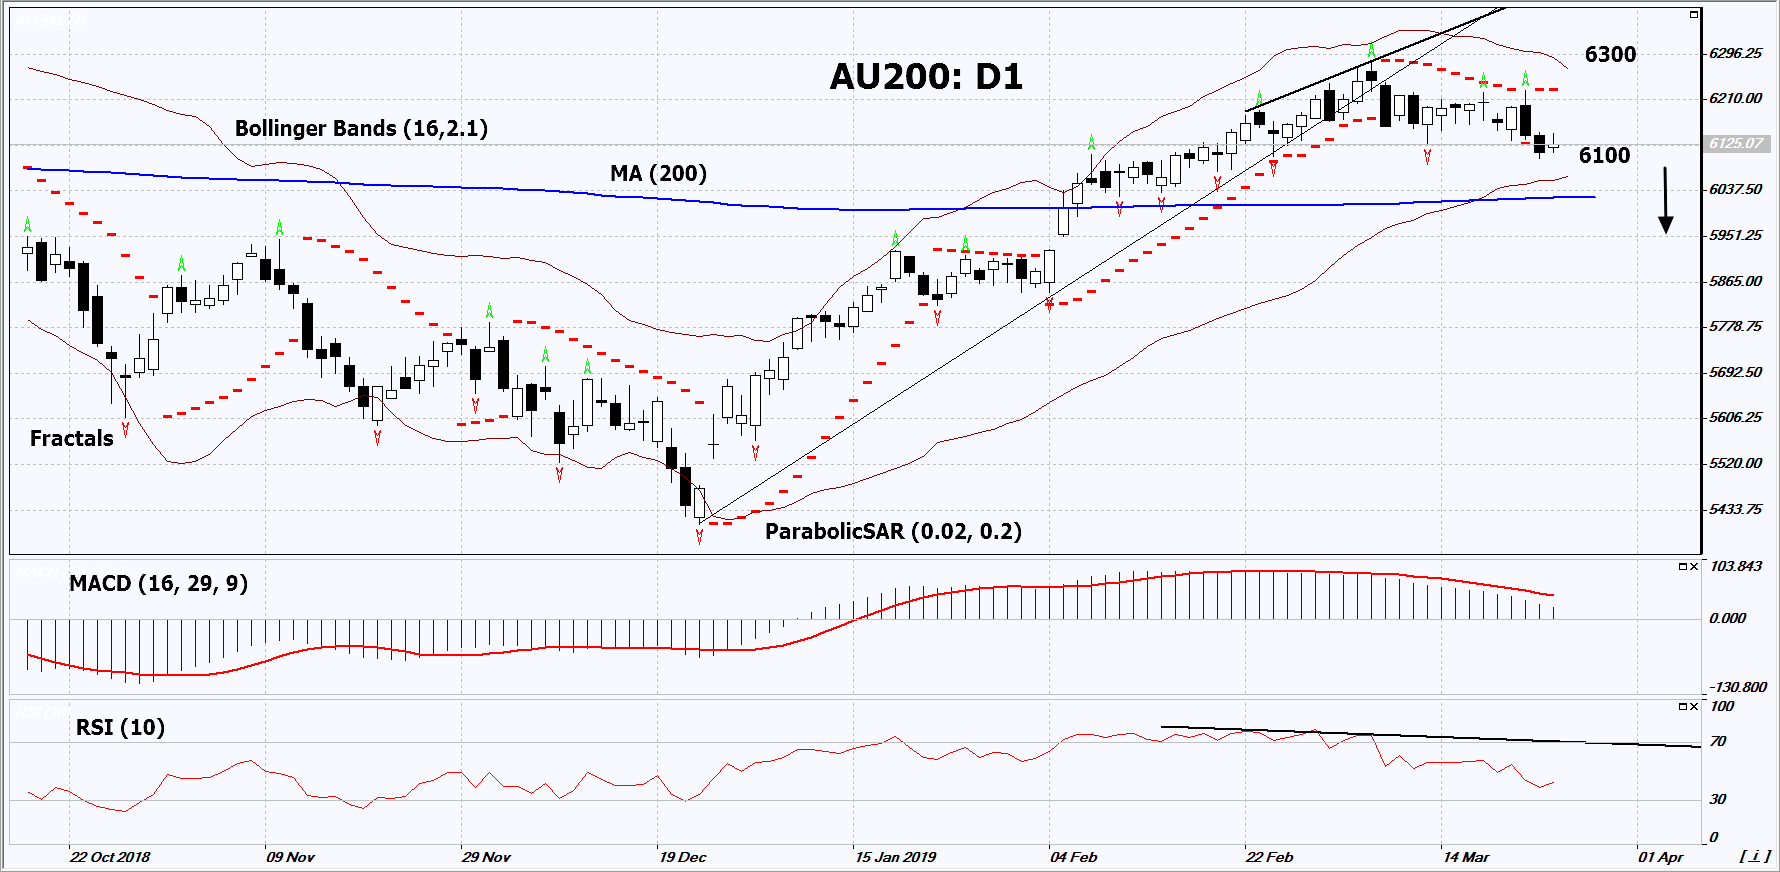
On the daily timeframe, AU200: D1 has left the uptrend and is trying to correct down. Most technical analysis indicators formed sell signals. A price decrease is possible in case of a slowdown in the global and Australian economies.
- The Parabolic Indicator gives a bearish signal.
- The Bollinger bands have narrowed, which indicates low volatility. The upper band is titled down.
- The RSI indicator is below 50. It has formed a negative divergence.
- The MACD indicator gives a bearish signal.
The bearish momentum may develop in case AU200 falls below its last low at 6100. This level may serve as an entry point. The initial stop loss may be placed above the three last fractal highs, the Parabolic signal, the high since September 2018 and the upper Bollinger band at 6300. After opening the pending order, we shall move the stop to the next fractal high following the Bollinger and Parabolic signals. Thus, we are changing the potential profit/loss to the breakeven point. More risk-averse traders may switch to the 4-hour chart after the trade and place there a stop loss moving it in the direction of the trade. If the price meets the stop level (6300) without reaching the order (6100), we recommend to close the position: the market sustains internal changes that were not taken into account.
Summary of technical analysis
| Position | Sell |
| Sell stop | Below 6100 |
| Stop loss | Above 6300 |
Explore our
Trading Conditions
- Spreads from 0.0 pip
- 30,000+ Trading Instruments
- Stop Out Level - Only 10%
Ready to Trade?
Open Account Note:
This overview has an informative and tutorial character and is published for free. All the data, included in the overview, are received from public sources, recognized as more or less reliable. Moreover, there is no guarantee that the indicated information is full and precise. Overviews are not updated. The whole information in each overview, including opinion, indicators, charts and anything else, is provided only for familiarization purposes and is not financial advice or а recommendation. The whole text and its any part, as well as the charts cannot be considered as an offer to make a deal with any asset. IFC Markets and its employees under any circumstances are not liable for any action taken by someone else during or after reading the overview.
