- Analytics
- Technical Analysis
AUD USD Technical Analysis - AUD USD Trading: 2018-07-11
Good economic data came out in Australia
Business conditions indices in Australia (NAB Business) showed an increase in June. Will the Australian dollar rise?
A number of economists and bankers believe that the Reserve Bank of Australia (RBA) will raise the rate in the foreseeable future. Currently, it is at a historically low level of 1.5%. Because of this, Australian 10-year government bond yields dropped to 2.64%, which is lower than the similar US securities (2.86%). Such a situation on financial markets is observed for the first time in the last 18 years. The next RBA meeting will be held on August 7, 2018. A rate hike is not expected during the meeting, but market participants do not exclude any statements regarding the future monetary policy. Another factor supporting the Australian dollar is the softening of the US and China rhetoric in the discussion of mutual foreign trade restrictions. China is the major consumer of Australian mineral resources and agricultural products.
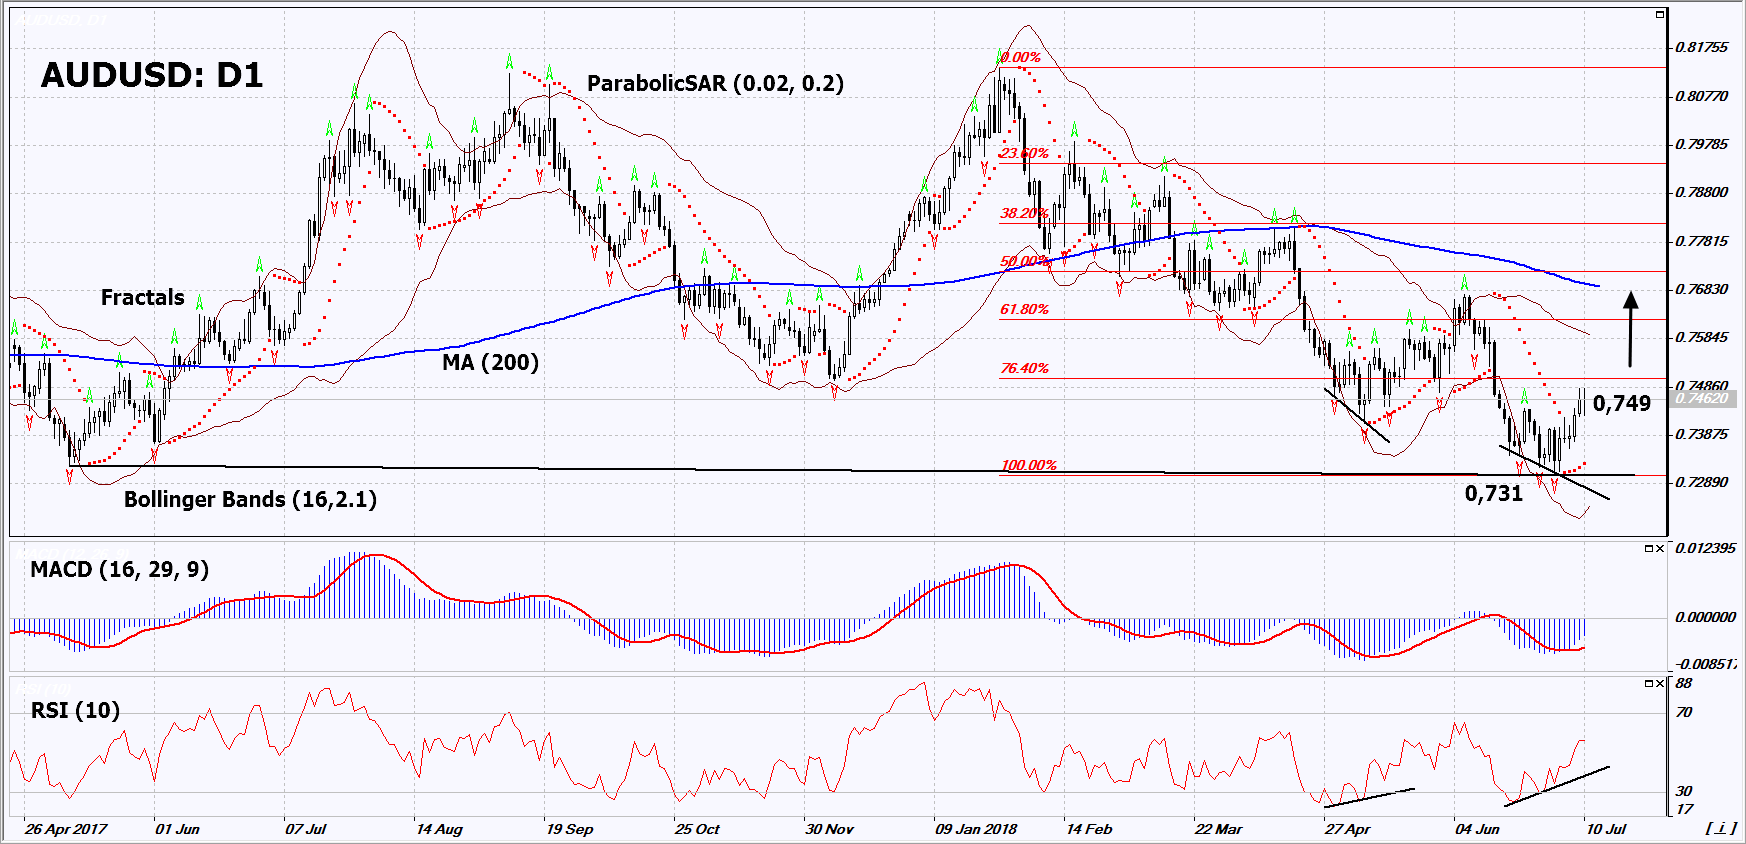
On the daily timeframe, AUDUSD: D1 remains in the falling channel. However, now it is correcting up after reaching the support line of the long-term neutral range. A number of technical analysis indicators formed buy signals. The further price increase is possible in case of the publication of good economic news in Australia and signs of the monetary policy tightening of the RBA.
- The Parabolic indicator gives a bullish signal.
- The Bollinger bands have widened, which indicates high volatility. The upper band is titled upward.
- The RSI indicator is above 50. It has formed a positive divergence.
- The MACD indicator gives a bullish signal.
The bullish momentum may develop in case AUDUSD exceeds its last high at 0.749. This level may serve as an entry point. The initial stop loss may be placed below the last fractal low, the 14-month low and the Parabolic signal at 0.731. After opening the pending order, we shall move the stop to the next fractal low following the Bollinger and Parabolic signals. Thus, we are changing the potential profit/loss to the breakeven point. More risk-averse traders may switch to the 4-hour chart after the trade and place there a stop loss moving it in the direction of the trade. If the price meets the stop level (0.731) without reaching the order (0.749), we recommend to close the position: the market sustains internal changes that were not taken into account.
Summary of technical analysis
| Position | Buy |
| Buy stop | Above 0.749 |
| Stop loss | Below 0.731 |
Explore our
Trading Conditions
- Spreads from 0.0 pip
- 30,000+ Trading Instruments
- Stop Out Level - Only 10%
Ready to Trade?
Open Account Note:
This overview has an informative and tutorial character and is published for free. All the data, included in the overview, are received from public sources, recognized as more or less reliable. Moreover, there is no guarantee that the indicated information is full and precise. Overviews are not updated. The whole information in each overview, including opinion, indicators, charts and anything else, is provided only for familiarization purposes and is not financial advice or а recommendation. The whole text and its any part, as well as the charts cannot be considered as an offer to make a deal with any asset. IFC Markets and its employees under any circumstances are not liable for any action taken by someone else during or after reading the overview.
